You will find a trades table on the “Classic Dashboard” as well as on the “Trades” section. Both trades table columns can be easily customized to contain stats that are more relevant to you.
For example, if you are an options trader you might want to see as columns the “Expiration(s)”, “Strike(s)”, and “Spread(s)” as columns. To achieve this follow these steps:
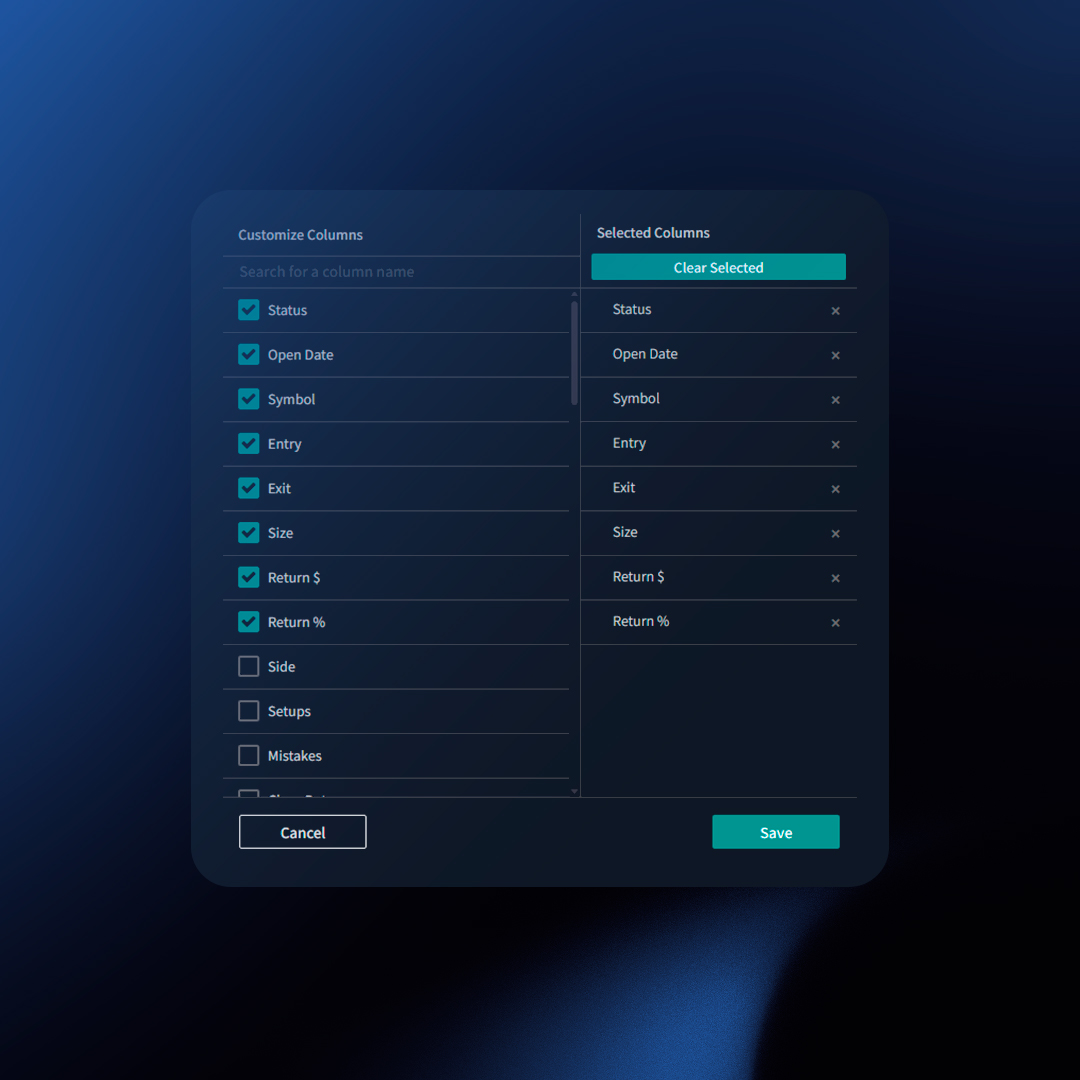
- On the trades table click on the gear icon.
- From the left panel select the stats or data points that you want to activate as columns.
- On the right column you will see a list of your current column selection, here you can rearrange them or remove any undesired columns.
- Click “Save”.
Considerations
- You can define a different set of columns on the Dashboard and on the Trades page.
- You can reorganize the order of the columns.
Available Columns Include
Core Trade Data
- Status: Outcome of the trade (Winner, Loser, Breakeven, Open).
- Open Date: Date the position was initiated.
- Close Date: Date the position was fully closed.
- Open Time/Close Time: Timestamps for the initial and final trade executions.
- Side: Long or Short.
- Symbol: The traded instrument.
- Portfolio: The account where the trade belongs.
- Size: Quantity traded.
Execution Details
- Entry Price: Price of the initial entry order.
- Exit Price: Price of the first closing execution.
- Avg Entry: Average price across all entry executions.
- Avg Exit: Average price across all closing executions.
- Executions: Count of individual executions within the trade.
Performance Metrics
- Return Gross: Gross profit/loss.
- Return Net: Profit/loss after commissions.
- Gross Return %: Percentage gain/loss.
- Net Return %: Percentage gain/loss after commissions.
- Gross R-Multiple: Trade’s return expressed as a multiple of the initial risk.
- Expectancy: (Needs a more trader-focused definition)
Risk & Reward
- Risk: Total amount risked on the trade.
- Stops: Initial stop-loss price.
- Targets: Initial target price.
- Profit Aim: Initial target return amount.
Error & Learning
- Mistakes: Tags for the specific errors made on the trade.
- Setups: The trading setups employed.
Easily customize your dashboard with widgets that display metrics relevant to your trading style. TraderSync offers two primary types of widgets:
- Top Widgets: Quick, single-value metrics for your dashboard or trades section.
- Side / Center Widgets: In-depth breakdowns of performance are displayed on your dashboard’s right sidebar or the Snapshot report.
How to Select Side / Top Widgets
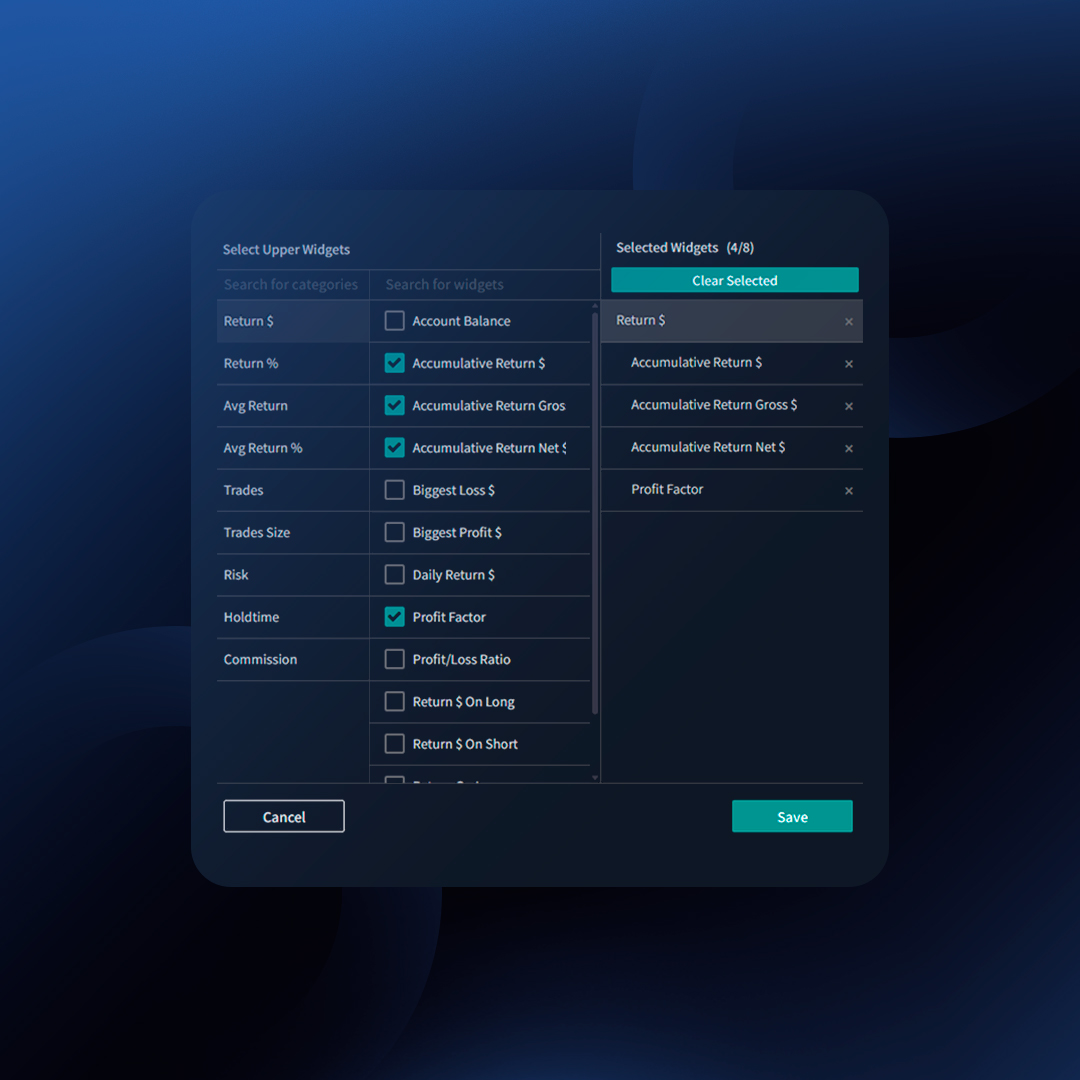
- Click on the top right-hand side icon that contains 9 dots.
- Click on “Manage Top Widgets” or “Manage Side Widgets“.
- Select the metrics that are relevant to you.
- Click “Save“.
Notes:
- You can pick up to 8 widgets.
- You can reorganize the order of the widgets.
Examples of Widgets in Action
- Account Performance Widget: Track your overall progress with Accumulative Return $, Win %, and more.
- Hourly Widget: See if certain times of day are more profitable. Optimize your trading schedule accordingly.
- Setups Widget: Analyze the profitability of specific setups. Discover what works and where to focus improvement.
List of Side/ Center Widgets
Explore the full power of Report Widgets with these options:
- Tags (Setups, Mistakes, Custom Tags)
- Timeframes (Hourly, Weekday, Monthly, Yearly)
- Entry Price
- Volume
- Status (Winners, Losers, Breakeven, Open)
- Side (Long/Short)
- Spread (Options)
- Symbol
- Call/Put (Options)
- Calendar
- Trading Plan
List of Top Widgets
Click here to view them all.
How Are the Widgets Constructed?
Each widget is built using three key data points:
- Ranges/Buckets: The categories being evaluated (e.g., days of the week such as Monday, Tuesday, etc.).
- Return: The total profit or loss within each category (e.g., total return on Monday, total return on Tuesday).
- Proportional Impact: The significance of each category compared to others, shown as a percentage. This helps identify which category contributes the most to your overall performance.
Example: Day of the Week (Buckets)
| Day of the Week (Buckets) |
Return |
Proportional Impact |
| Monday |
200 |
40% |
| Tuesday |
-50 |
25% |
| Wednesday |
-150 |
60% |
| Friday |
300 |
75% |
Determining the Proportional Impact
Step 1: Calculate the totals for all winners and losers.
- Total Winners: $500 = $200 (Monday) + $300 (Friday)
- Total Losers: -$200 = -$50 (Tuesday) + -$150 (Wednesday)
Step 2: Calculate the percentage for positive and negative buckets.
Winners:
- Monday: 40% = $200 (Return on Monday) / $500 (Total Winners) * 100
- Friday: 60% = $300 (Return on Friday) / $500 (Total Winners) * 100
Losers:
- Tuesday: 25% = $50 (Return on Tuesday) / $200 (Total Losers) * 100
- Wednesday: 75% = $150 (Return on Wednesday) / $200 (Total Losers) * 100
By analyzing these metrics, you can identify which days are most profitable and adjust your trading strategy accordingly.
Other Considerations
When you apply filtering criteria to your Trading Journal, all widgets will be updated to reflect the filtered data. This means that the metrics displayed in the widgets will adjust according to the criteria you have set, ensuring that you are viewing the most relevant and specific information for your analysis.
 Labor Day Sale — Up To 50% Off