Trading without a plan is like driving a car without a steering wheel. You need a plan to follow, a strategy to stick to, and a way to track your progress. Monitoring your progress based on the plan will create a clear vision of what you are doing right and wrong.
Before creating a trading plan, we highly suggest identifying the patterns you want to focus on and avoid. Here is a great article that shows you how to do that.
How to Create a Trading Plan
- Click “Create Trading Plan”
- Type the Plan Name
- Select a Date Range:
- From: Select when you started the plan. If you are starting today, select today’s date.
- To: Select the end date for this plan. Leave it blank if it will not have an end date.
- Select Portfolios: Choose the portfolio you plan to follow with this Trading Plan.
- Define Trades to Focus: For example, if the “Gap and Go” setup brings 80% of your profit, specify that you only want to trade this setup. Trades outside this setup will be tagged as outside the plan.
- Define Trades to Avoid: For example, if trading on Fridays leads to significant losses, specify in the plan to avoid trading on Fridays. Any trade placed on Friday will be tagged as outside the trading plan.
Defining Criteria for Trades to Focus and Trades to Avoid
- Daily Count: The number of trades taken per day.
- Setup: The trading strategy or setup used.
- Mistake: Any errors or deviations from the plan.
- Week Day: The specific days of the week trades are taken.
- Size: The size of the trade or position.
- Month: The months during which trades are taken.
- Hour: The hours of the day trades are executed.
- Side: The direction of the trade (long or short).
- Asset: The specific assets being traded.
- Max Accum. Trade Loss: The maximum accumulated loss from trades.
- Sector: The sector of the assets being traded.
- Volume Change: Changes in trading volume.
- Max Accum Daily Loss: The maximum accumulated loss for a day.
- Max Individual Trade Loss %: The maximum loss percentage for a single trade.
- Max Daily Individual Trade Loss: The maximum loss for an individual trade in a day.
- Max Accumulated Daily Loss: The maximum total loss for a day.
- Entry Price: The price at which trades are entered.
- Month Count: The number of trades taken per month.
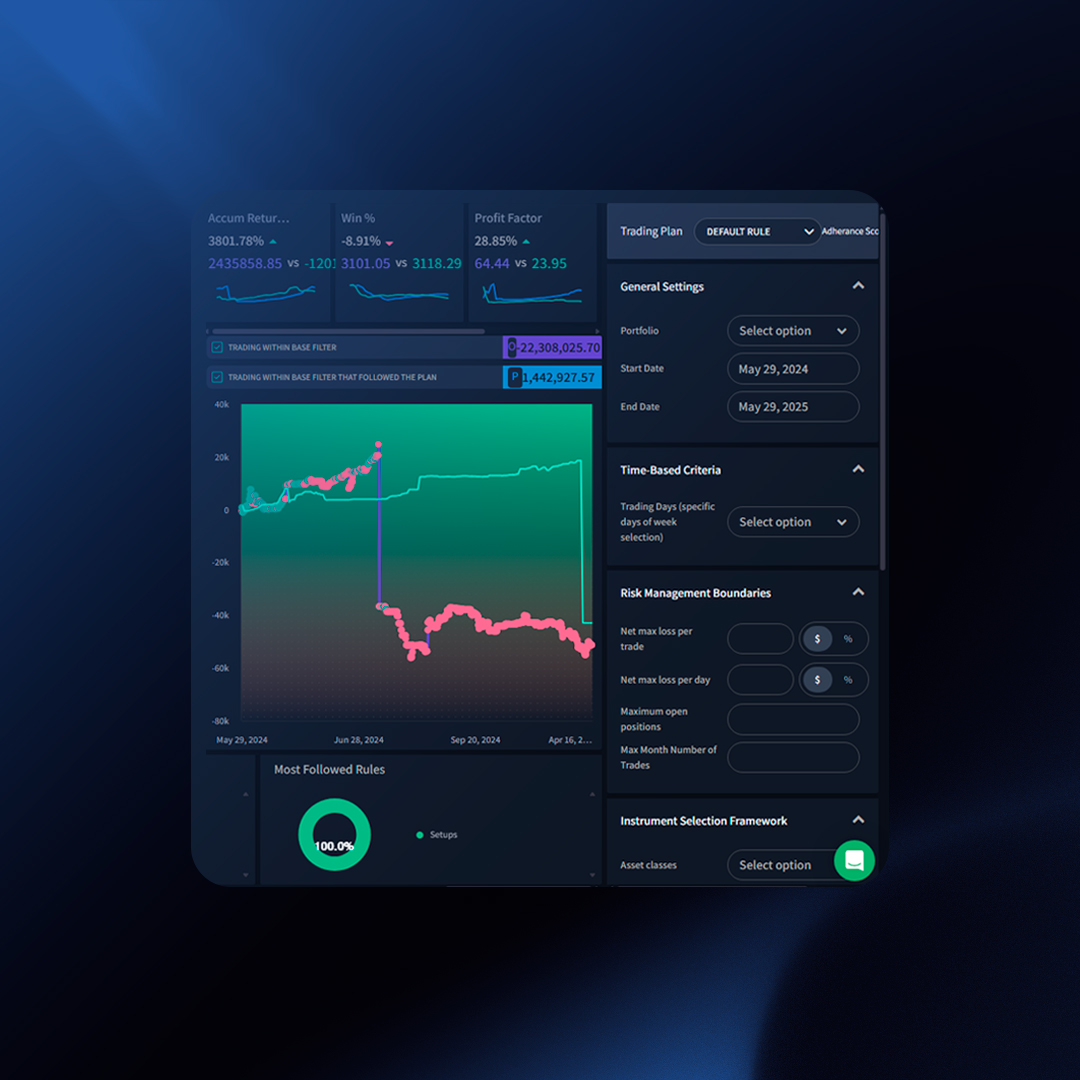
Tracking Plan Progress
- The Green Line: Represents your original equity curve.
- The Purple Line: Represents the equity curve for trades within the plan’s criteria, based on Portfolio and Date Range.
Under the purple line, you will see two colored dots:
- Green: Trades that have followed the trading plan.
- Red: Trades that have not followed the trading plan.
Your goal is to ensure all trades under the purple line stay green, indicating adherence to the plan and that you are on track.
Understanding Calculations
Potential Performance: The room for improvement based on past trades.
For example, assume you placed four trades:
- Trade 1: $10 – Followed the plan
- Trade 2: $20 – Did not follow the plan
- Trade 3: -$30 – Did not follow the plan
- Trade 4: $40 – Followed the plan
Current PnL: $40 (10 + 20 – 30 + 40)
PnL on Trades That Followed The Plan: $50 (10 + 40)
Potential PnL: $100 (10 + 40 + 10 + 40)
Essentially, we replace trades that did not follow the plan with trades that did, assuming similar PnL outcomes. The potential performance is the difference between the current PnL and potential PnL, highlighting the opportunity for improvement.
Adding the Trading Plan Widget
Once you have defined your trading plan, we suggest adding the “Trading Plan” widget to your dashboard. This will help you monitor how well you’re following the plan as you continue to trade.
Fine-tuning your trading strategy is all about making informed decisions. Our new Benchmarking feature empowers you to do just that by letting you easily compare your performance against a market index.
What is Benchmarking?
Benchmarking is the practice of comparing your trading results to a standard reference point. In this case, you’ll be able to benchmark your performance against a widely recognized market index, like the S&P 500 or the SPY (an ETF that tracks the S&P 500).
How Does it Work?
Benchmarking in our platform is straightforward:
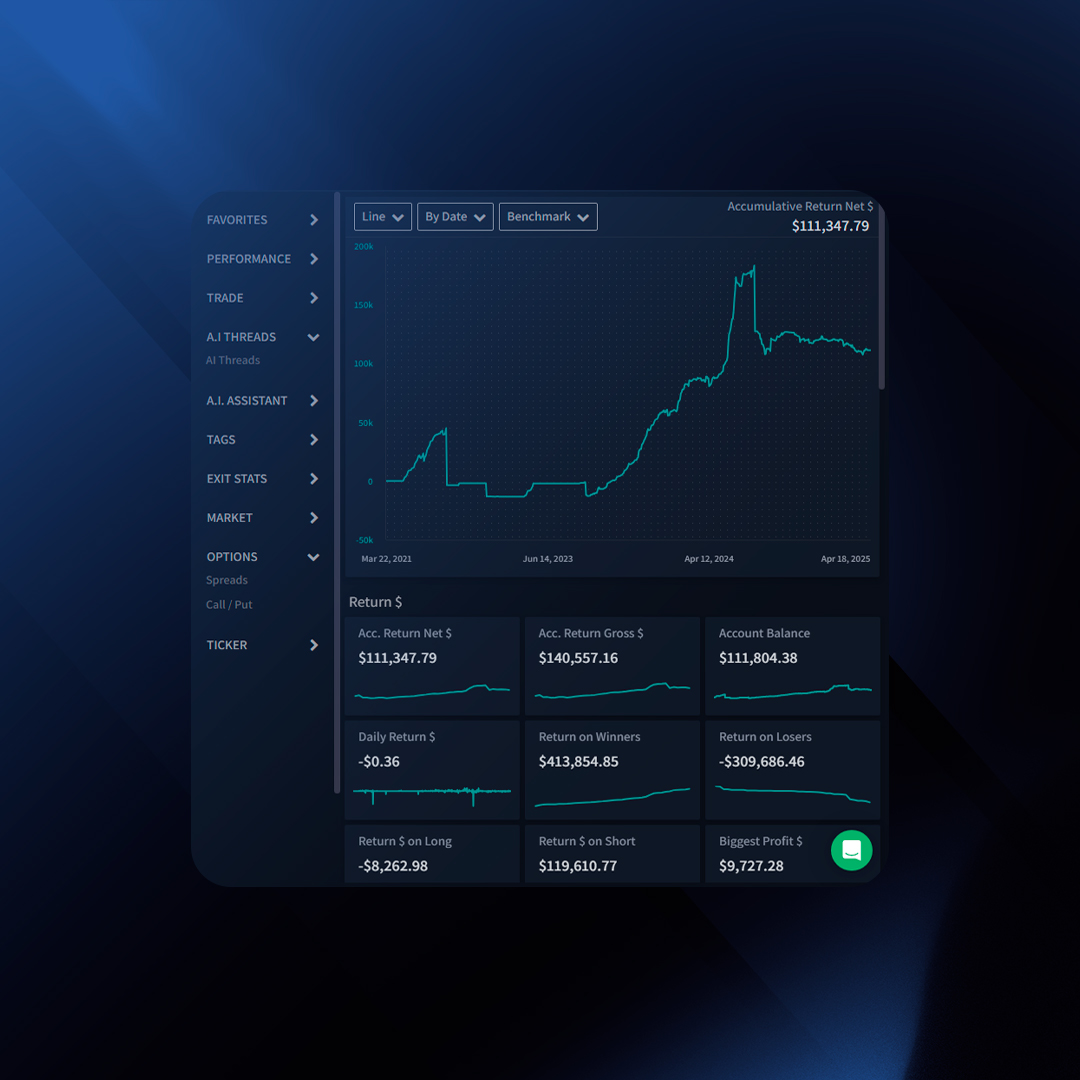
- See Your Cumulative Returns: Go to the “Reports” section and view your “Accumulative Return $” chart.
- Choose a Time Period: Select a timeframe that aligns with your trading goals, whether it’s a day, week, month, or even a year.
- Pick Your Benchmark: Decide which market index you want to compare against (e.g., S&P 500 or SPY).
- Visualize Your Performance: Our intuitive charting will display two lines:
- Benchmark Line: This line represents the performance of the index you selected.
- Your Performance Line: This line tracks your P&L (profit or loss) or equity curve (total account value) over the chosen period.
Benefits of Benchmarking
- Gain Perspective: Benchmarking allows you to see how your trading strategy performs relative to the overall market.
- Identify Opportunities: By visualizing your performance alongside the benchmark, you can identify areas for improvement and adjust your strategy accordingly.
- Set Realistic Goals: Understanding how your performance stacks up against a market benchmark can help you set realistic goals for your trading activity.
Going Beyond the Benchmark
Remember, outperforming the market consistently is a challenging feat. However, using the benchmark as a reference point can provide valuable insights into your trading effectiveness.
Ready to take your trading to the next level? Get started with Benchmarking today!
Backtesting is the process of testing a trading strategy against historical market data to simulate its potential performance. It helps you gain insights into a strategy’s strengths and weaknesses before risking real capital.
How can I get started?
-
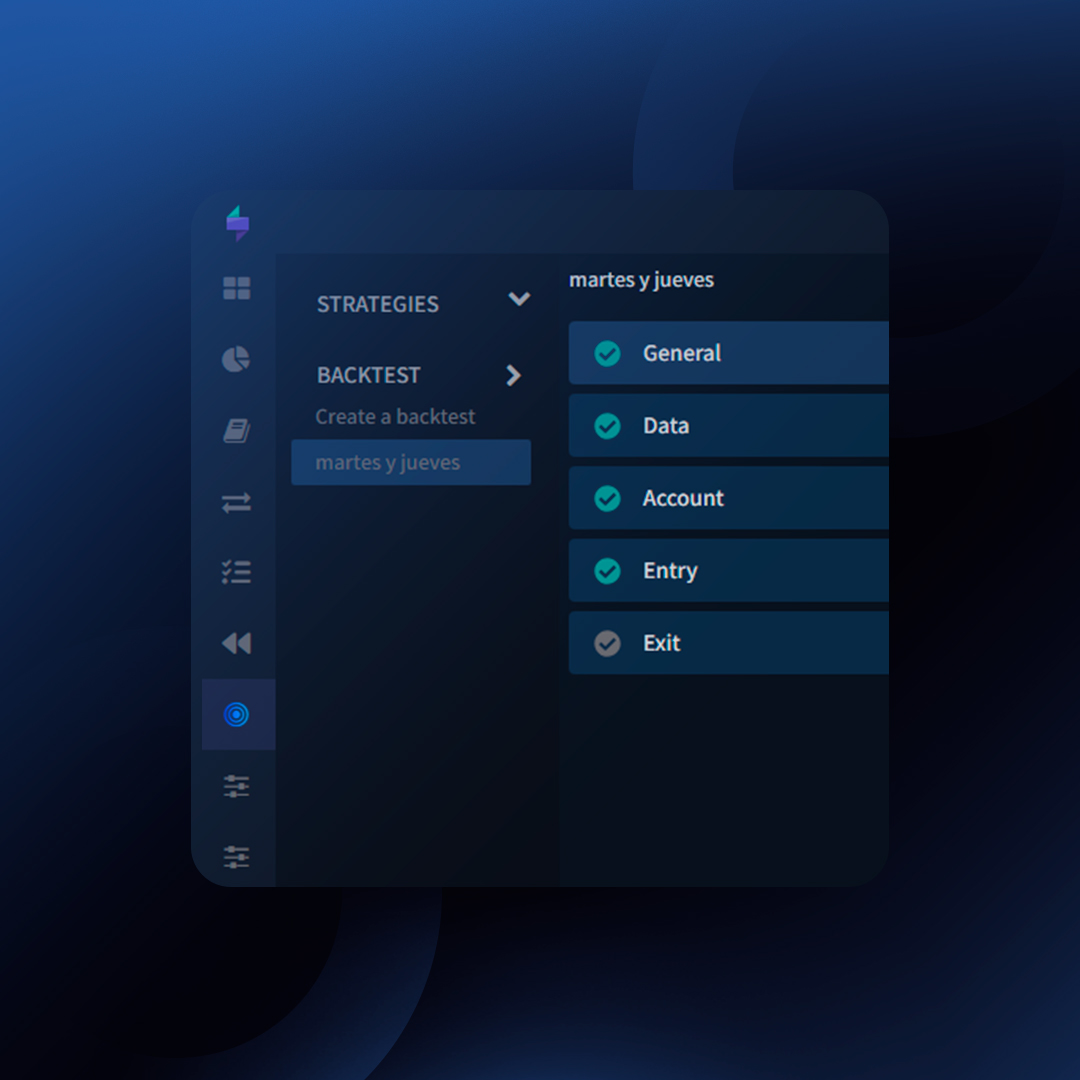
- Click on the “Strategy” icon on the left menu.
- Click on “Backtest“.
Creating a Backtest
- Click “Create Backtest.“
- General Settings
- Name: Give your backtest a descriptive title.
- Description: Add a brief explanation of your strategy.
- Data to Test
- Date: Select your desired start and end dates.
- Bars Deep: How much historical data to backtest.
- Precision: Candle size (e.g., 1 minute, 1 hour).
- Side: Long or Short trades.
- Trade By: Price point on a candle for evaluation (e.g., close price).
- Extended Hours: If backtesting stocks, choose whether to include pre/post-market data.
- Tickers: Select the asset(s) for your test. Start with one, then add more once you’ve verified that the backtest functions properly.
- Account Details
- Initial Capital: Realistic starting balance.
- Cash Sharing (Multi-Ticker Tests Only): Decide if you want to split capital.
- Commissions: Set default amount.
- Entry Conditions
- Click “+” to add an entry rule.
- Select from 70+ indicators, 100+ candlestick patterns, or basic price conditions.
- Example: “RSI (14) crosses above 70.”
- Exit Conditions
- Follow the same “+” process.
- IMPORTANT: Stop losses and targets take priority over indicator/candle conditions.
- Aim to include at least a stop loss and a target.
Considerations:
- Click on indicator names to fine-tune their parameters.
- To run a backtest, you must fill up all the required fields detailed above in this article. Only once you fill up all this information, you will see the “Run Backtest” button.
Running a Backtest
- Once your strategy is defined, click “Run Backtest“
- This may take a few seconds to minutes, depending on your settings.
Analyzing Backtest Results
The results page provides a summary of your backtest’s performance.
Key Metrics: Win Rate, Profit Factor, Expectancy, Drawdowns, and more.
Deeper Analysis with TraderSync Analytics
- Click “Export Trades” to create a portfolio of your backtest results.
- Analyze further within TraderSync Analytics to pinpoint areas for improvement.
Remember
- Backtesting is an iterative process. Test, refine, and retest!
- Beware of overfitting your strategies to the past.
 Labor Day Sale — Up To 50% Off