TraderSync gives you flexibility in how you view your trading performance. Quickly switch between these views with just a few clicks:
- Gross vs. Net: See your profits before or after commissions and fees.
- R-Multiple vs. Currency: Analyze your results in terms of risk-adjusted returns (R-Multiple) or your account’s currency (e.g., USD).
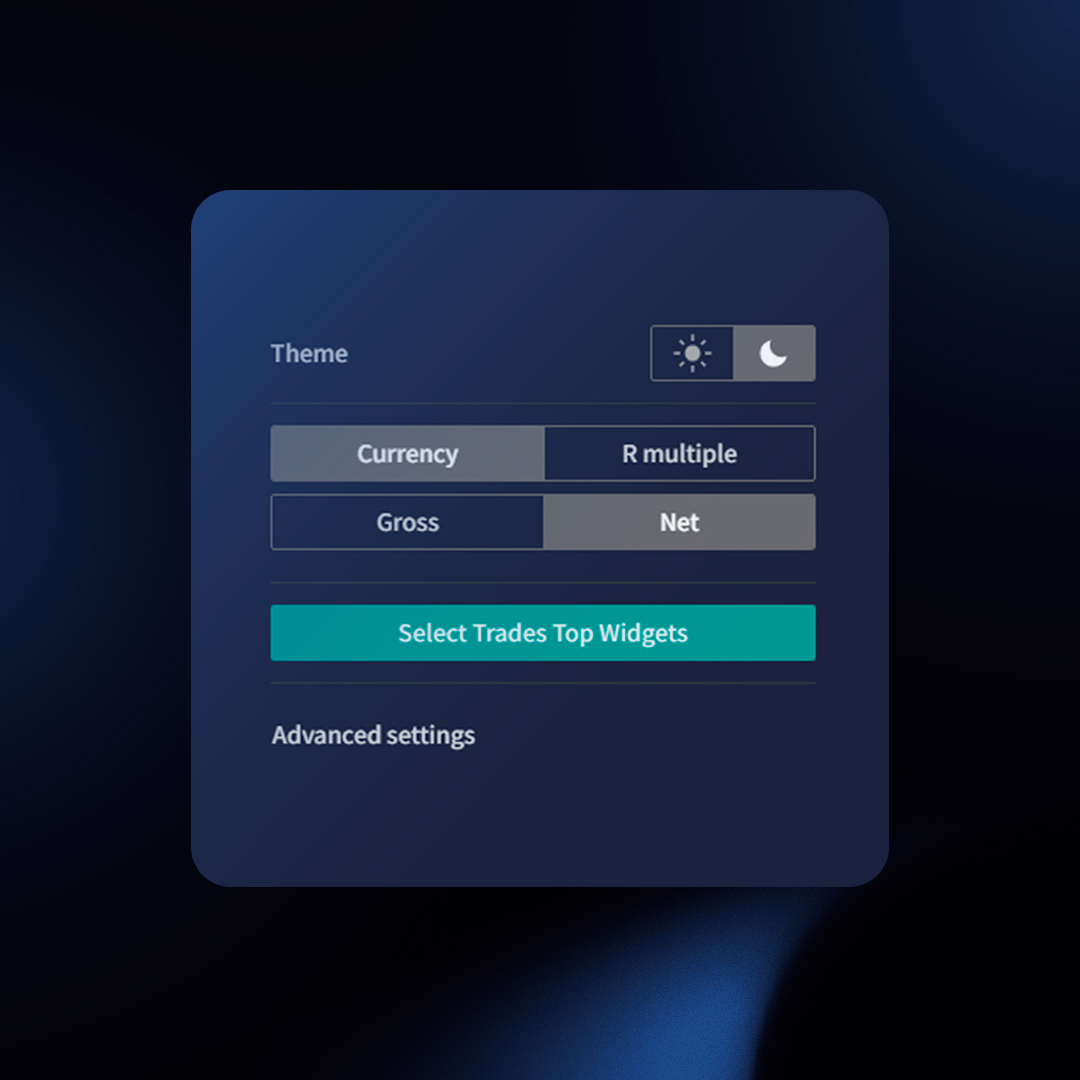
How to Switch Views
- Click the nine-dot icon in the top right corner.
- Choose either “Currency” or “R-Multiple“.
- Your stats will instantly update across:
- Top and Center Widgets
- All Reports
What This Affects (and Doesn’t)
- Affected: The widgets and reports.
- Not Affected:
- Trades Table (you can customize columns to show both “Return” and “R-Multiple“)
- Trade Detail page stats
- Simulator
- Evaluator
- Trading Plan
Get the insights that matter most to you. Experiment with these views to see your trading performance from different perspectives!
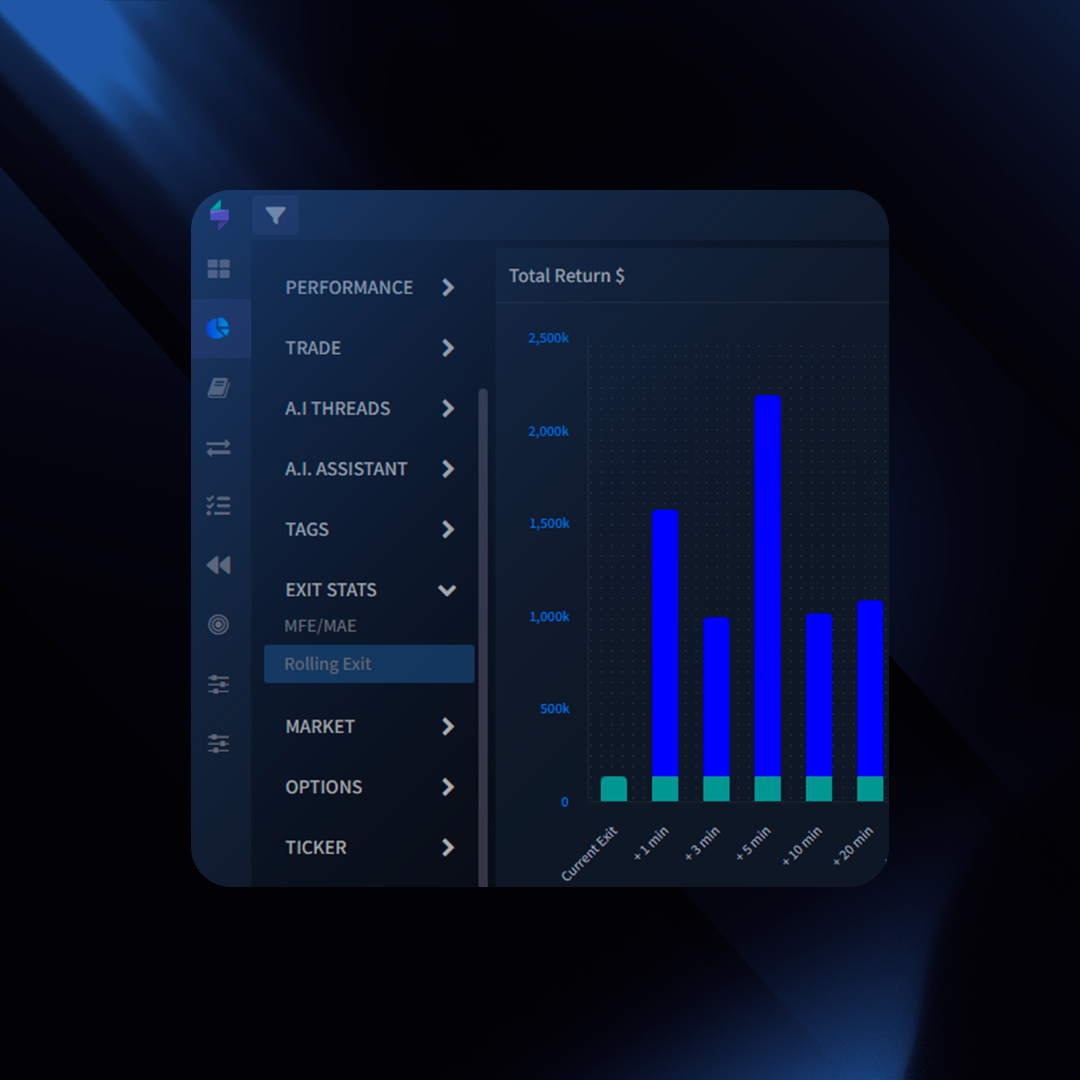
Rolling exits allow you to know how much Return or R Multiple you would have made or lost if you had exited your position for a certain amount of time after your original exit.
How does it exactly get calculated?
Let’s go through this example:
Original Trade
- 10:02:00 – Buy 4000 Shares @ 1.2594
- 11:08:00 – Sell 4000 Shares @ 1.4078
Now, let’s assume that instead of exiting at 11:08:00, we exited X minutes later. What would the exit price and return have been?
| Entry Time |
Entry Price |
|
Exit Time |
Exit Price |
Return |
| 10:02:00 |
1.2594 |
Original Exit |
11:08:00 |
1.4078 |
$593.60 |
| 10:02:00 |
1.2594 |
Exiting 1 Min Later |
11:09:00 |
1.4100 |
$602.40 |
| 10:02:00 |
1.2594 |
Exiting 5 Min Later |
11:13:00 |
1.4150 |
$620.40 |
| 10:02:00 |
1.2594 |
Exiting 9 Min Later |
11:17:00 |
1.4200 |
$638.40 |
| 10:02:00 |
1.2594 |
Exiting 1 Hour Later |
12:08:00 |
1.4300 |
$676.40 |
From the example above, we can clearly tell that if we had held our position 1 more hour, we would have made significantly greater returns.
Considerations
- Only the last closing execution is considered. We will take the last closing execution quantity and calculate what if this last execution would have been X amount of time later.
How can I use this information to help me make better decisions?
Of course, in hindsight, you can tell that it would have been better to have exited later. However, the true value of this comes into play when you aggregate your data and see the overall picture among all your trades to determine if you are exiting too early.
This is something that can be clearly answered in your Rolling Exit report.
The report above shows us what would have been our total extra return if we had moved our last closing execution X amount of time later into the future.
For example, it suggests for this particular example that exiting +10 minutes later could produce an extra $X. This tells us that we might be exiting our positions too early and perhaps we should consider holding them longer for about 10 minutes.
Considerations
- Abnormal results that deviate from your average results will not be considered in these reports as they can provide false positives. For example, if in most of your trades you normally make anywhere from -1R to 2R and there are a few trades with 10R, we will exclude those.
Where to access the Rolling Exit Report?
- Click on “Reports” on the left menu on TraderSync
- On the left sidebar, click the report “Rolling Exit”.
Ever wonder, “What if I only traded on Tuesdays?” or “How would my results differ if I used a different setup?” TraderSync’s Simulator lets you answer these questions and more, empowering you to explore potential improvements to your current approach.
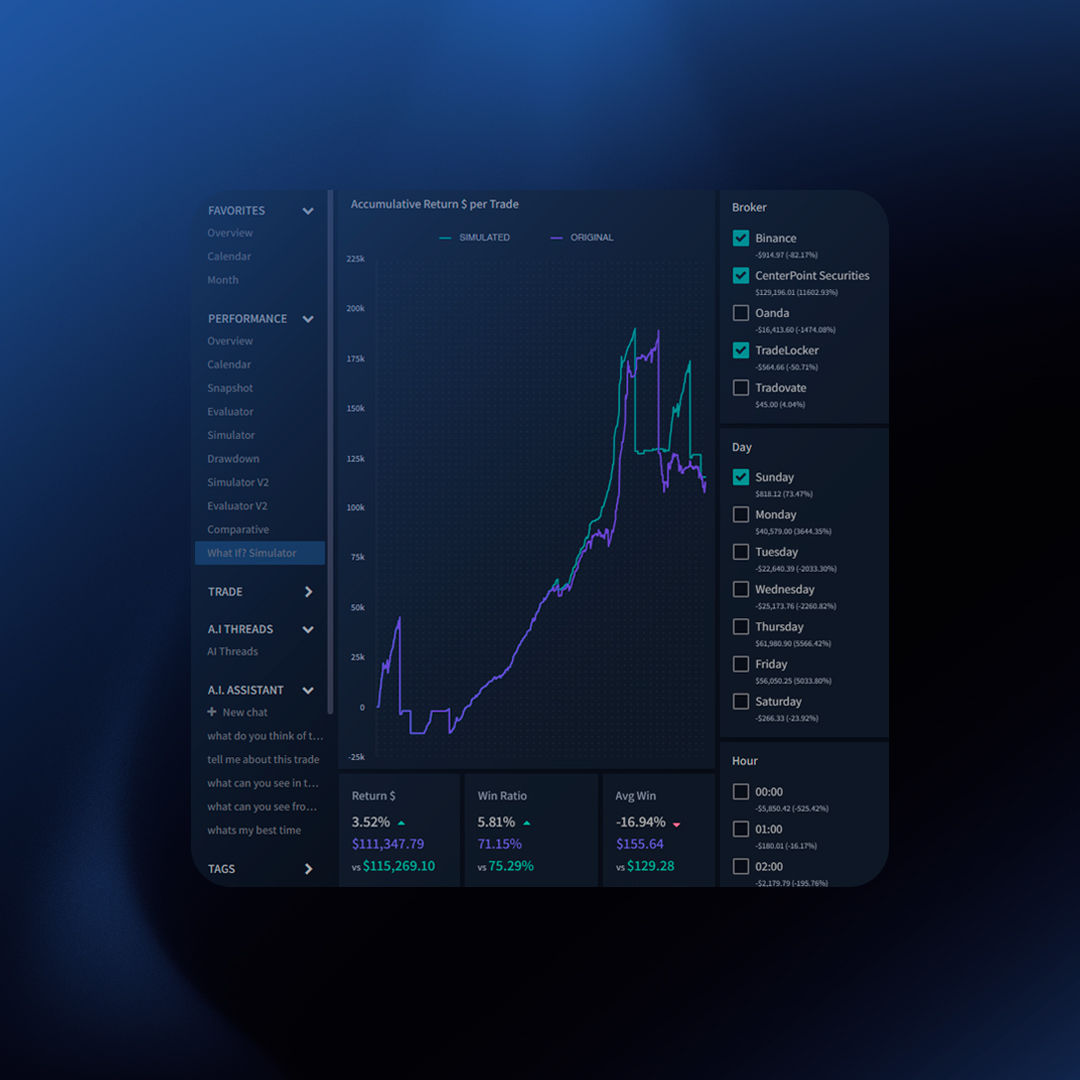
How the Simulator Works
- Create Your ‘What If’ Scenario: Define the criteria you want to test. This could be based on a setup, time of day, specific mistake, or any combination of factors.
- Visualize Your Simulated P&L: TraderSync generates two lines:
- Purple Line: Shows your original P&L for reference.
- Green Line: Shows your simulated P&L based on the chosen ‘What If’ scenario, filtering for trades that specifically match your criteria.
- Analyze and Compare: Evaluate the performance of your simulated scenario versus your actual trading history.
Benefits of the Simulator
- Identify Hidden Potential: Uncover setups, times, or conditions that might yield better results than your current strategy.
- Test Before Deploying: Reduce risk by simulating changes to your trading approach before risking capital.
- Data-Driven Decision Making: Base your trading adjustments on visual evidence rather than just hunches.
Example: Optimizing with the Simulator
Imagine you’re primarily a morning trader, but wonder if afternoons hold untapped potential. Here’s what you could do:
- Set Up the Scenario: Create a “What If” scenario for afternoon trades only.
- Analyze the Results: The Simulator reveals that your afternoon P&L is significantly better than your morning performance.
- Take Informed Action: Based on this data, you might consider shifting your trading focus to afternoons.
Important Disclaimer
Please remember that past performance does not guarantee future results. The Simulator is a powerful tool for exploration, not a crystal ball. Use it wisely!
Ready to Explore? Dive into TraderSync’s Simulator and discover how you might enhance your trading outcomes!
TraderSync empowers you to constantly improve your trading strategies. Our innovative Evaluator feature takes your analysis a step further by enabling you to compare the performance of different trading ranges on a visual graph.
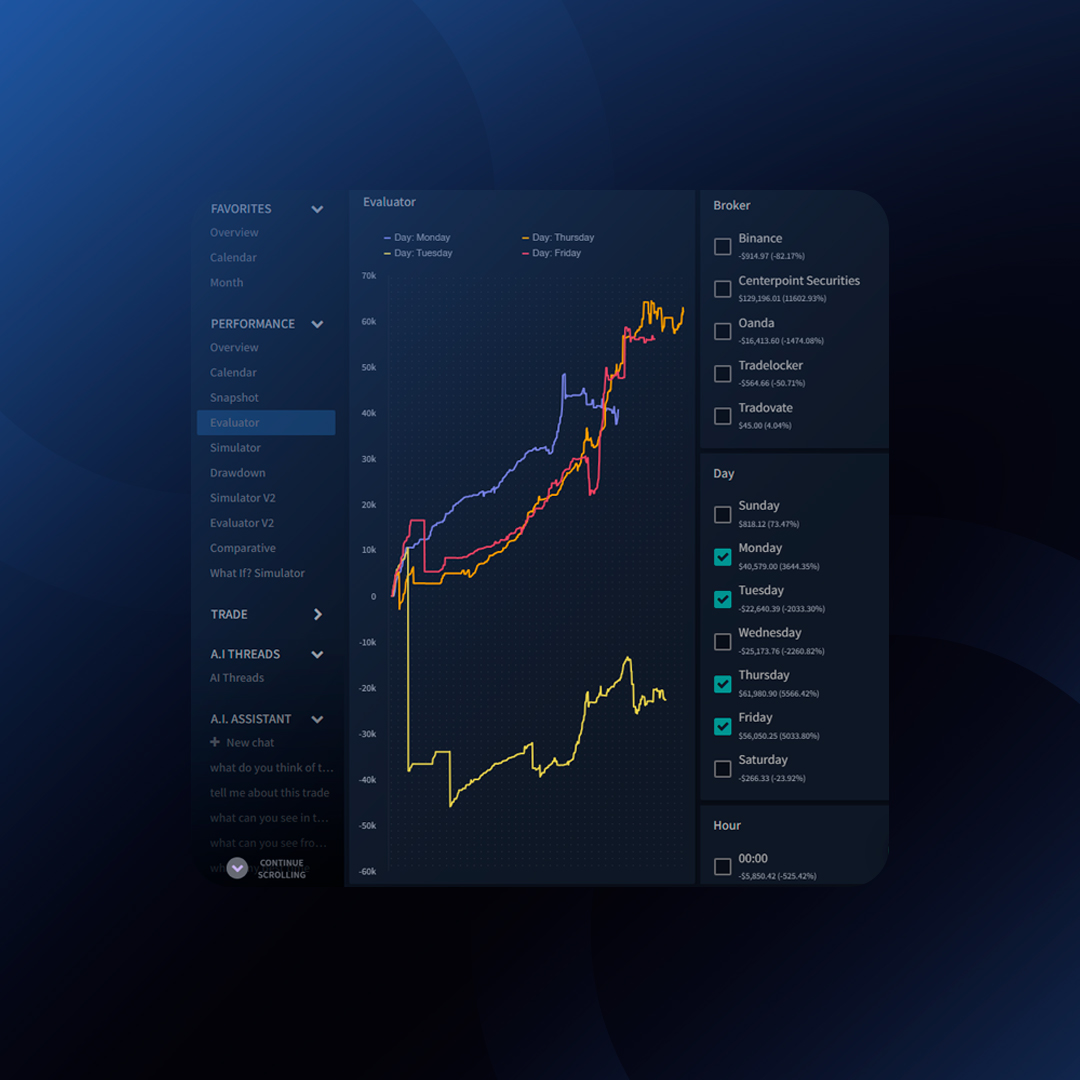
What is the Evaluator?
The Evaluator allows you to “stack” multiple data ranges and visually analyze how each one performs over time. This comparison helps you identify which setups, mistakes, volume ranges, or even trade quantities yield the best results.
Unlocking Insights with Range Comparison
Imagine wanting to compare the performance of two of your favorite setups: “Morning Breakout” and “Bullish Flag” With the Evaluator, you can:
- Select Your Ranges: Simply choose the “Morning Breakout” and “Bullish Flag” setups.
- Visualize Performance: The Evaluator generates a graph showcasing the P&L or equity curve for each setup over time.
Benefits of Range Comparison
- Identify Winning Strategies: See which setups, mistakes, volume ranges, or trade quantities consistently produce the best results.
- Refine Strategies: Gain insights into underperforming ranges and tweak your approach to improve them.
- Data-Driven Decisions: Back your trading decisions with visual evidence of historical performance.
The Power of Ranging Beyond Setups
The Evaluator isn’t limited to setups. Here’s the versatility it offers:
- Compare Mistakes: Analyze which mistakes cost you the most and adjust your trading behavior accordingly.
- Volume and Quantity Analysis: Identify volume or quantity ranges with superior performance and tailor your position sizing strategies.
- Time-Based Performance: Compare performance across entry price ranges, days of the week, or months of the year to uncover seasonal trends.
The Evaluator empowers you to become a data-driven trader by comparing the performance of various trading ranges. Start using it today to refine your strategies and unlock your full trading potential.
 Labor Day Sale — Up To 50% Off