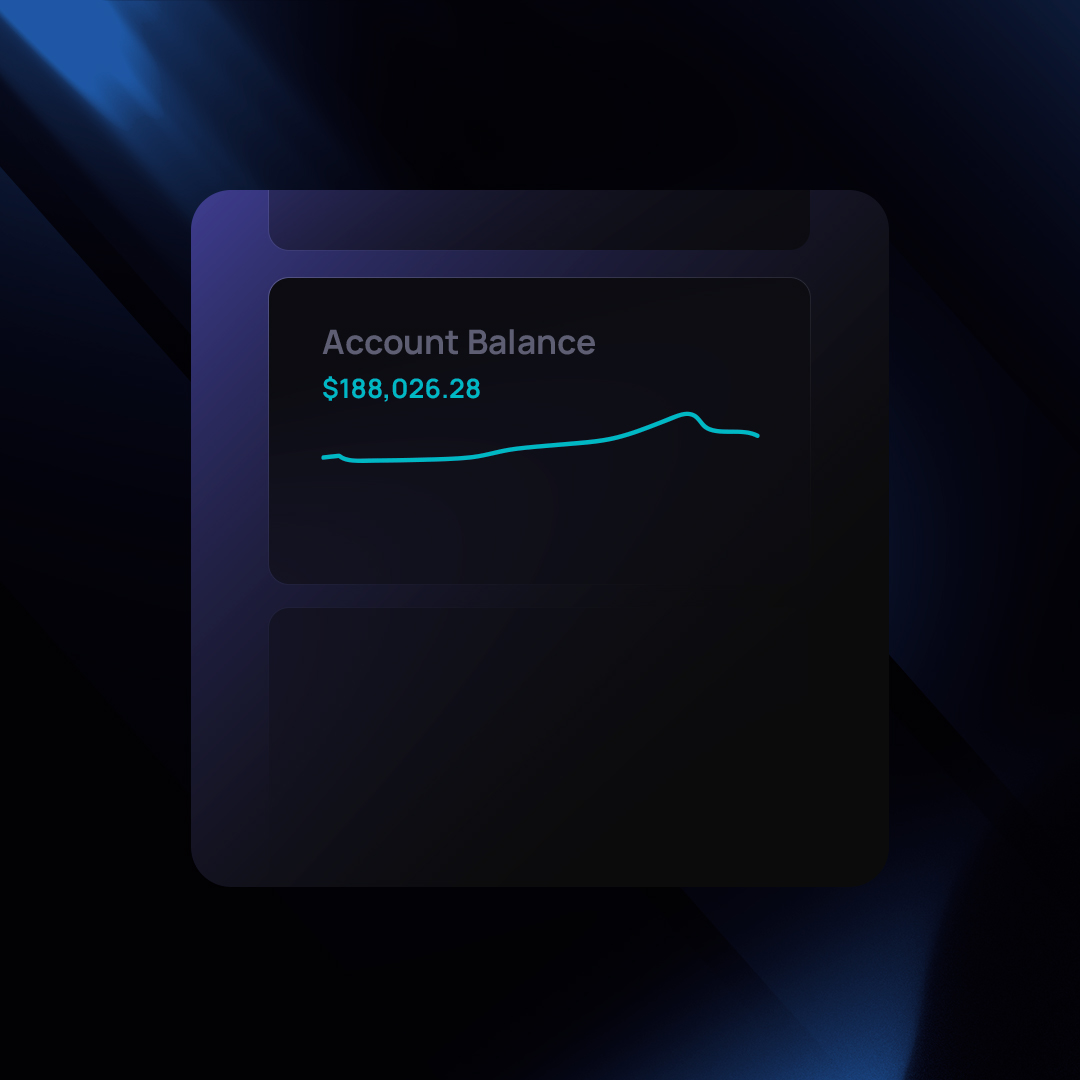
TraderSync empowers you to analyze your trading performance with insightful tools. However, it’s important to understand the distinction between tracking performance and mirroring your account balance.
Focus on Performance, Not Account Balance
TraderSync excels at analyzing your trading performance, measured by factors like:
- Individual Trade Performance: Track the P&L (profit or loss) for each trade.
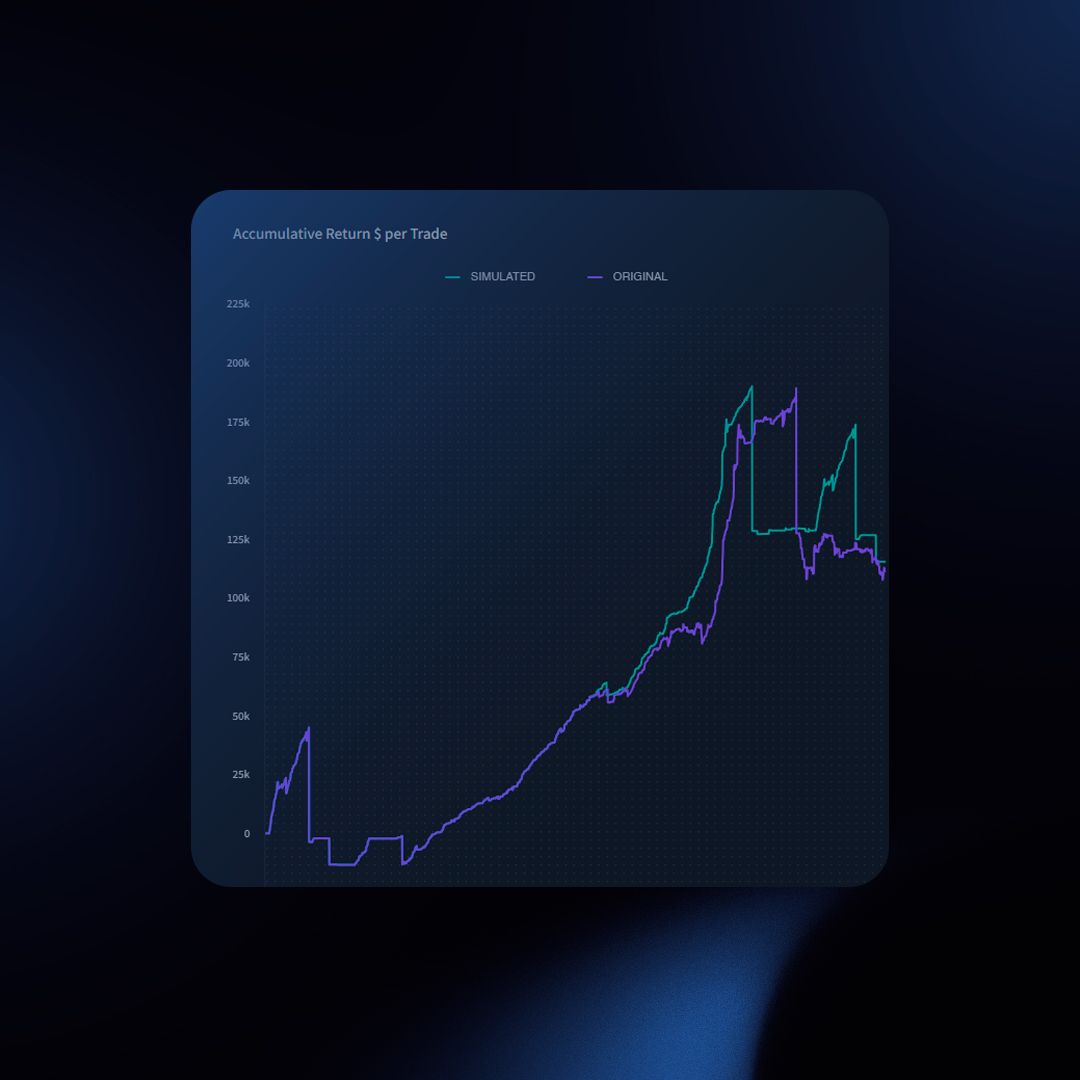
- Accumulated Return: Track the overall profitability of your trading activity.
This performance analysis is independent of your current account balance. It focuses on the effectiveness of your trading decisions, not the current state of your account.
Why Account Balance Matching Can Be Difficult
TraderSync doesn’t directly replicate your account balance for several reasons:
- Account Adjustments: Account balance discrepancies arise from deposits, withdrawals, interest fees, and other adjustments. Many brokers don’t offer a convenient export of these adjustments, making it challenging to import them accurately into TraderSync.
- Transferring Positions: Moving positions between brokers introduces complexities. The receiving broker might not have information about your initial purchase price, creating inaccuracies.
- Missing Trades: Incomplete trade data from your broker (due to limited history access) can lead to an unbalanced picture of your overall P&L.
A Workaround: Manual Account Adjustments
TraderSync offers a “manual account adjustments” feature for users who want to reconcile their account balance. This involves manually entering details for deposits, withdrawals, and fees. While helpful, this method requires significant effort and potentially time-consuming data gathering from your broker statements.
Focus on What Matters: Performance Analysis
TraderSync’s core strength lies in analyzing your trading performance. By focusing on individual trade results and accumulated returns, you gain valuable insights into your trading effectiveness. This knowledge empowers you to make informed decisions for future trades.
TraderSync: Your Performance Analysis Partner
While TraderSync might not directly mirror your account balance, it provides comprehensive tools to analyze your trading performance. Embrace this approach to gain valuable insights and optimize your trading strategies.
While TraderSync offers powerful insights into your trading performance, attempting to perfectly match your account balance stats with your broker’s statements can be a frustrating endeavor. Here’s why, and how to approach account adjustments effectively.
What are Account Adjustments?
These are transactions that affect your account balance but aren’t directly related to trades:
- Deposits and Withdrawals
- Internal Transfers (between sub-accounts, if applicable)
- Broker Fees (interest, transfer fees, wire fees, margin interest, etc.)
- Dividends, Interest, or Borrow Fees
- … and more!
Why Matching Is Difficult
- Incomplete Broker Data: Not all brokers provide a detailed breakdown of every fee or adjustment impacting your balance.
- Reporting Differences: Brokers may calculate account balances in unique ways (e.g., settled vs. unsettled funds) that don’t perfectly align with TraderSync’s calculations.
- The Time Investment: Manually tracking down and inputting every adjustment can be incredibly time-consuming and prone to error.
TraderSync’s Recommendation
We strongly advise focusing on analyzing your trading performance, rather than fixating on an exact account balance match. Account adjustments are provided as a tool for those willing to put in the significant effort, but the results may still be imperfect due to factors outside your control.
In the world of trading, raw profit and loss (PnL) figures can be deceiving. A big win on a single trade might mask a series of smaller losses that erode your overall performance. This is where R-Multiple comes in, providing a standardized way to measure and analyze your trading results for better decision-making.
What is R-Multiple and Why Does it Matter?
R-Multiple Defined: R-Multiple represents the return on your investment expressed as a multiple of your initial risk. The “R” signifies the amount of money you were willing to risk on a trade, determined by the placement of your stop-loss order. A positive R-Multiple indicates a profitable trade, while a negative R-Multiple denotes a loss.
Importance: R-Multiple provides these key benefits:
- Standardization: It standardizes performance across different trades, regardless of investment size. This allows for apples-to-apples comparisons.
- Risk Perspective: R-Multiple focuses on risk management, highlighting the relationship between your potential gains and the amount you’re willing to lose.
- Long-term Focus: It encourages a long-term mindset, emphasizing consistency over single-trade windfalls.
Why Your Trading Journal Needs R-Multiple Reporting
A trading journal that tracks R-Multiple offers significant advantages:
- Pattern Identification: Analyzing R-Multiples over time reveals consistent patterns in your trading style, whether you tend to make larger gains with higher risk or smaller gains with tighter risk controls.
- Strategy Evaluation: It allows you to assess the effectiveness of different strategies based on their average R-Multiple.
- Weakness Detection: Low or negative R-Multiples on a specific strategy pinpoint areas for improvement or potential abandonment.
Why Traders Should Prioritize R-Multiple over PnL
Focusing on R-Multiple fosters a healthier trading approach:
- Sustainable Returns: A trader with a consistent positive R-Multiple, even with periods of smaller losses, is likely to achieve sustainable long-term profitability.
- Discipline: Emphasizing R-Multiple reinforces the importance of disciplined risk management.
- Reduced Emotional Impact: It helps minimize the emotional roller coaster of big wins or losses, promoting more rational decision-making.
Understanding “R” – The Bedrock of Risk Management
Before calculating your R-Multiple, you must clearly define your risk (“R”). This is the amount of capital you’re willing to potentially lose on a trade. Experienced traders often express this as a percentage of their total trading account.
Here’s why a precise “R” is essential:
- Protects Your Capital: Safeguards against single trades wiping you out.
- Determines Trade Size: Ensures you trade an appropriate size relative to your risk tolerance.
- Maintains Consistency: Keeps your risk exposure similar across trades, regardless of market volatility.
- Calculating R-Multiple: A Simple Formula, Powerful Results
Calculating your R-Multiple is straightforward:
- Determine Your Risk (“R”): Subtract your entry price from your stop-loss price.
- Calculate Your Profit or Loss: Subtract your entry price from your exit price.
- Divide the Profit or Loss by Risk: This gives you the R-Multiple.
Example: Calculating R-Multiple
Let’s say you buy a stock at $100 and place a stop-loss order at $95. Your initial risk (R) is $5 per share. If you sell the stock at $110, your profit is $10 per share. Here’s the R-Multiple calculation:
- Profit: $10
- Risk: $5
- R-Multiple: $10 / $5 = 2R
This means you made twice your initial risk on the trade.
How to Use R-Multiple in Your Trading
- Track Performance in a Trading Journal: A dedicated journal like TraderSync helps you record and analyze your R-Multiples over time.
- Identify Patterns: Look for trends in your R-Multiple. Do you excel in certain setups or consistently underperform in others?
- Evaluate Strategies: Compare the average R-Multiples of different trading strategies to see which align with your risk tolerance and profit goals.
- Set Targets: Aim for a positive average R-Multiple over time. Consistency is key!
- Focus on Risk-Reward: Instead of obsessing over individual trade outcomes, prioritize finding trades with favorable risk-reward ratios as indicated by their potential R-Multiples.
Key Takeaways
While PnL is essential, R-Multiple provides deeper insights into your trading performance. By tracking R-Multiple in your trading journal and focusing on maintaining a positive average over time, you’ll cultivate a more successful, risk-conscious, and sustainable approach to the markets.
How to Start Tracking Your R and R Multiple on TraderSync?
We highly recommend you swap from viewing results in PnL to R Multiple so you can start building a risk profile.
To achieve that:
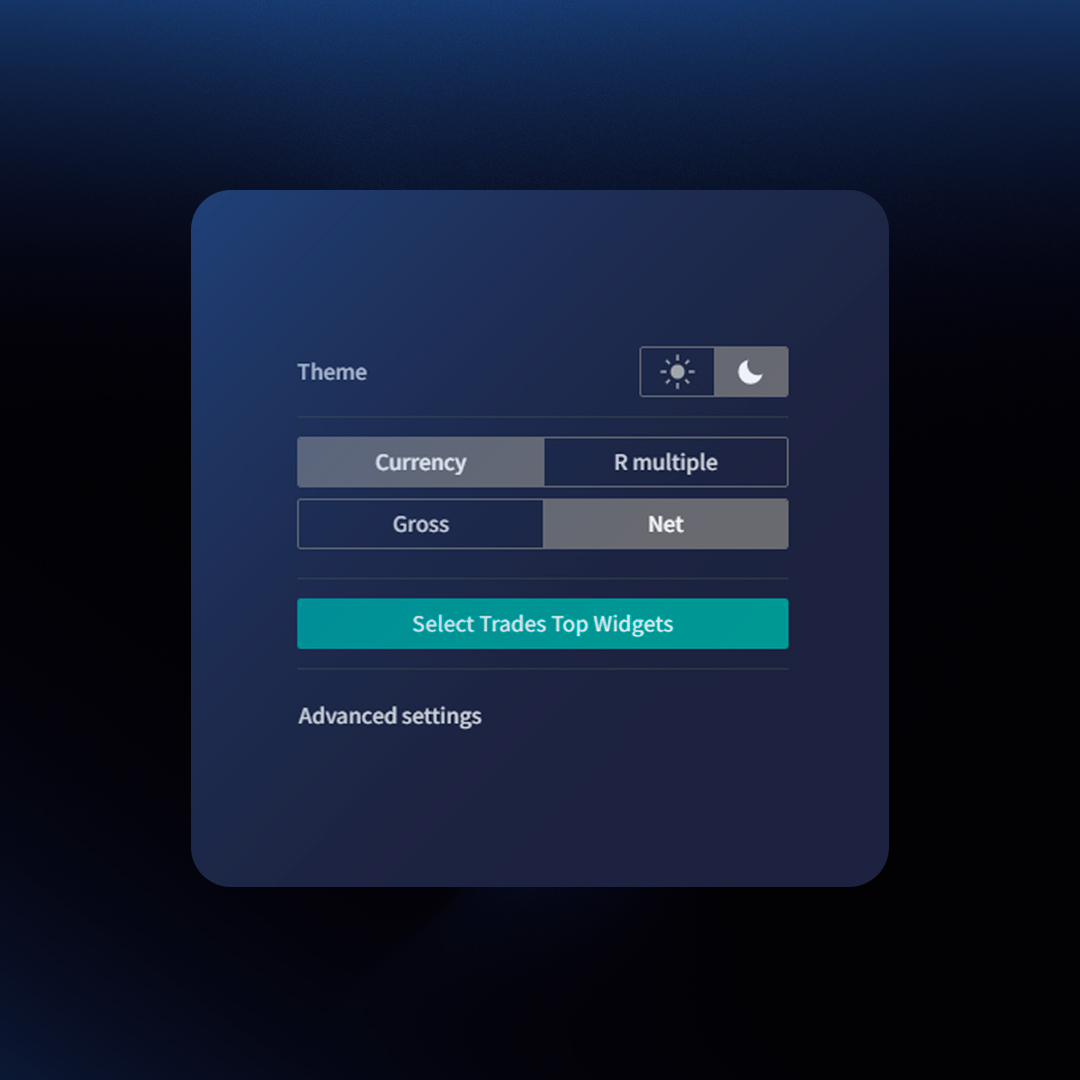
- Click on the gear icon on the top right corner of TraderSync
- Click on R Multilple
That is it, all your analytics except for the trades table will be swifted to R Multiple.
Keep in mind that only those trades that have a risk defined will be taken into account in the metrics. This is why it is very important you input your risk into each one of your trades.
Adding the Risk to Your Trades
You have two methods of adding a risk to your trades.
Method 1: Adding one by one
- Click on a trade
- Scroll down to the stop-loss section and enter your risk
Method 2: Set a default risk to all your trades automatically
- Click on “Configuration” bottom left icon
- Click on “Targets & Stops” from the left menu
- Select “yes” on the dropdown menu where it reads “Activate default Targets and Stop Losses”
- Define your Targets and stops wether it is on a currency value to percentage
Once you do that, it will take a few minutes and the system will automatically assign this as the default target and stops to your trades, allowing you to have a clear view of your R Multiple when analyzing your reporting.
Traders have unique needs. That’s why TraderSync offers customizable dashboards, putting the metrics you value most at your fingertips. Get a quick performance snapshot or drill down into specific trades – it’s your command center!
Layouts
Choose the layout that best suits your trading style:
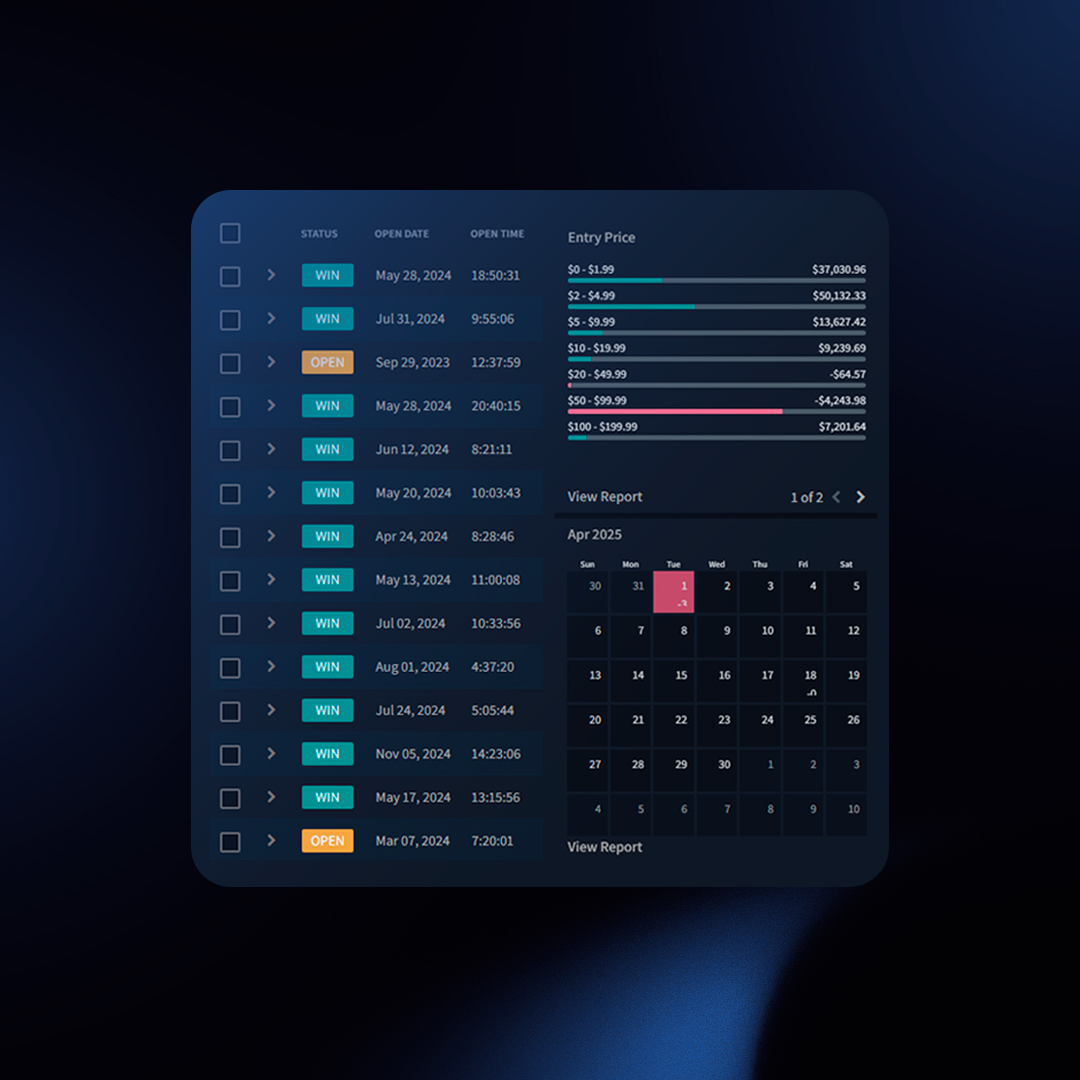
Classic (Trade-Focused)
Top widgets, customizable trades table, side widgets. Ideal for analyzing individual trades.
Tips & Tricks
- Hide Widgets (Optional): Uncheck “Display Top Widgets” or “Display Side Widgets” via the nine-dot icon for a cleaner view.
- Detailed Reports: Some side widgets offer a “View Report” link for deeper analysis.
- Trades Table: Customize columns to include metrics like R-Multiple by visiting [link to trades table customization instructions].
Snapshot (Stats-Focused)
Top and center widgets with key performance metrics. Provides a high-level performance overview.
Tips & Tricks
- Snapshot Access: This view is also accessible from your Reports page regardless if you choose to have it on your dashboard or not. To access this, click on “Reports” from the left menu, then click on “Snapshot” under the “Performance” tab.
Customizing Widgets
Choose from over 40+ performance metrics to tailor your dashboard to your exact needs.
- Click the three-dot icon in the top right corner of any widget.
- Select “Select Widgets.”
- Add or remove from our library of 40+ metrics to personalize your view.
- Click “Save.”
Switching Layouts
- Click the nine-dot icon in the top right corner of your dashboard.
- Use the “Pinned dashboard” dropdown to select “Classic” or “Snapshot.”
Unlock Deeper Trading Insights with Custom Tags
TraderSync’s Custom Tags feature empowers you to track the unique factors that influence your trading decisions and results. Go beyond standard metrics and create categories that resonate with your trading style.
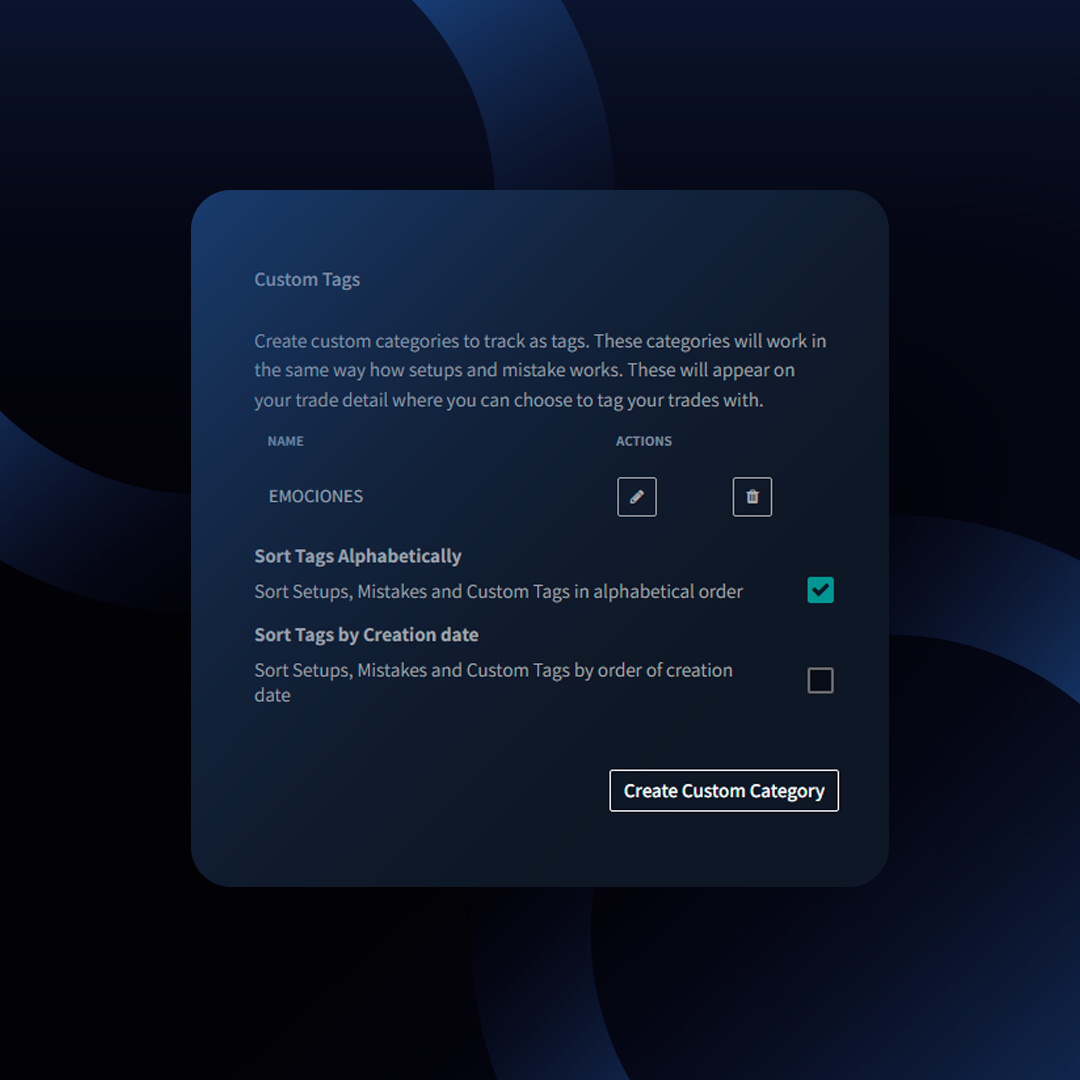
What are Custom Tags?
- Custom Categories: Define your own tracking areas, like “Emotions,” “Indicators,” “Catalysts,” or anything else that matters to you.
- Specific Tags: Within each category, create individual tags (e.g., “Excited,” “Sad,” “Stressed” under “Emotions“).
- Targeted Analysis: TraderSync automatically generates reports for each custom tag category, revealing patterns that impact your performance.
Benefits of Custom Tags
- Identify Hidden Drivers: Understand how specific emotions, indicators, or market catalysts influence your trading outcomes.
- Find Winning Patterns: Uncover what works for you and replicate your success.
- Minimize Weaknesses: Recognize recurring factors that lead to losses and adjust your strategies accordingly.
Example: Tracking Emotions
- Create an “Emotions” Category: Add tags like “Excited,” “Sad,” “Focused,” or any emotions you frequently experience while trading.
- Tag Your Trades: As you review your trades, tag them with the emotions you felt during execution.
- Analyze Your Emotions Report: TraderSync generates a dedicated “Emotions” report, revealing performance trends connected to specific emotional states.
How to Use Custom Tags
- Create Your Categories: Go to the Configuration section and start defining your custom tag categories.
- Add Specific Tags: Populate each category with the relevant tags that you want to track.
- Tag Your Trades: Diligently tag your trades with the appropriate custom tags.
- Review Custom Tag Reports: Analyze the dedicated reports TraderSync builds for each category, unearthing valuable insights.
The Power of Personalization
Custom Tags put you in control of your trading analysis. Experiment with different categories and tags to discover what drives your decision-making and ultimately optimize your performance.
Consistently tracking your setups and mistakes in TraderSync unlocks powerful analytics to help you improve. Here’s why it’s worth doing:
Benefits of Tracking Setups
- Identify Winning Strategies: See which setups consistently perform well for you.
- Troubleshoot Losing Setups: Drill down into underperforming setups to uncover why they’re failing and how to improve them.
- Gain Targeted Insights: TraderSync analyzes trades tagged with specific setups, giving you tailored performance metrics.
Benefits of Tracking Mistakes
- Pinpoint Costly Errors: Discover which mistakes are impacting your bottom line the most.
- Focus on Improvement: Prioritize fixing frequent mistakes to boost your trading results.
How to Track Setups and Mistakes
Tracking your setups and mistakes in TraderSync is straightforward. Follow these steps to get started:
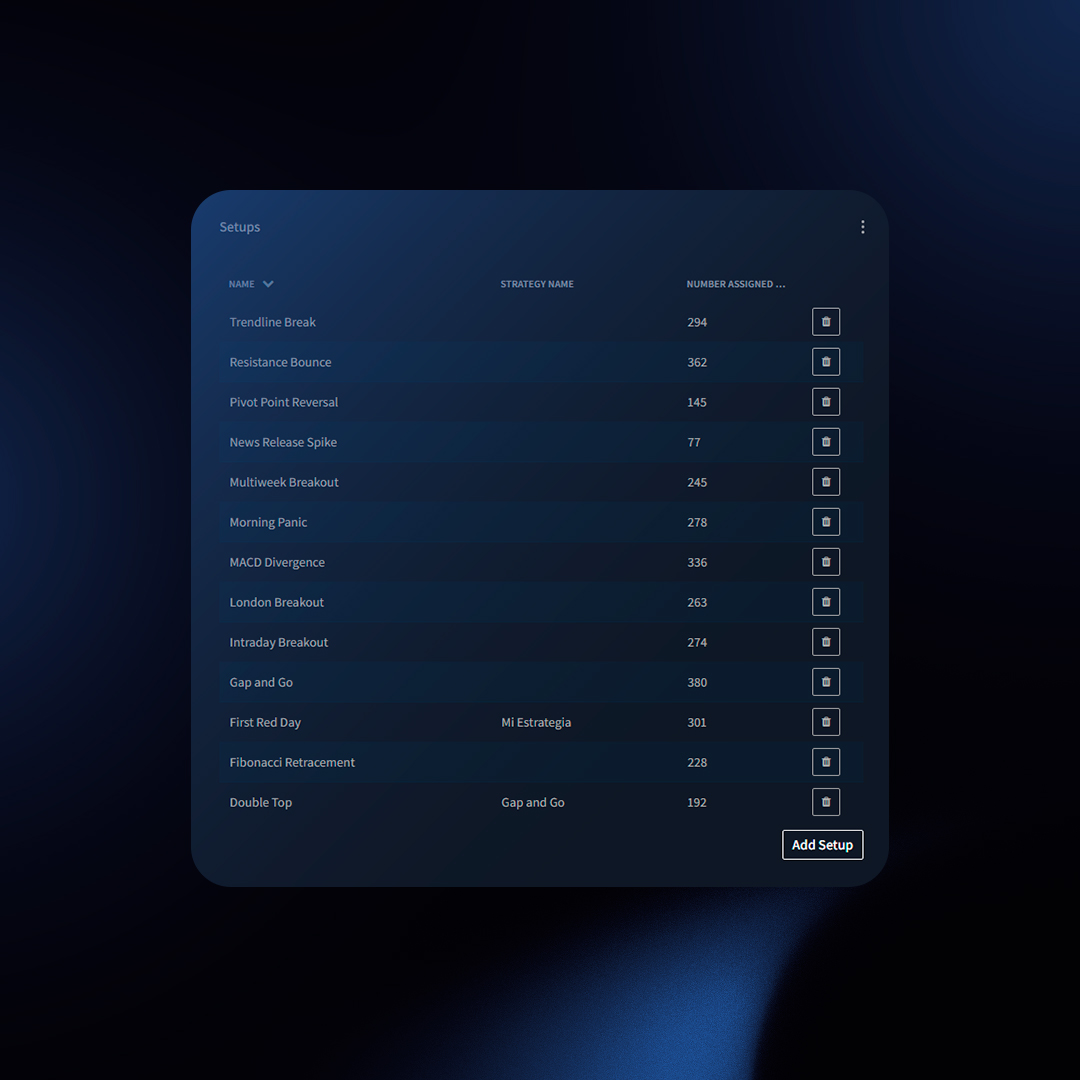
1. Creating a New Setup
How to Create a New Setup
2. Assigning Setups and Mistakes to Trades
Assigning Setups to Trades
Assigning Multiple Setups, Mistakes, or Custom Tags
3. Removing Setups and Mistakes from Trades
Removing Multiple Setups, Mistakes, or Custom Tags
Example: The Impact of Tracking Setups
Imagine you’ve been trading the “Morning Breakout” setup for the past month. By tracking this setup, you notice the following:
- High Success Rate: The “Morning Breakout” setup has a 70% win rate.
- Optimal Trading Time: Most successful trades occur between 9:30 AM and 10:30 AM.
- Common Mistake: A recurring mistake is holding onto losing trades for too long, leading to larger losses.
Actionable Insights:
- Double Down on Success: Focus your trading efforts on the “Morning Breakout” setup between 9:30 AM and 10:30 AM.
- Mitigate Losses: Implement a strict stop-loss policy to avoid holding losing trades for too long.
Reporting on Setups and Mistakes
Once you’ve tagged your trades, here’s how to analyze their performance:
Method 1: Dedicated Reports
- Click on “Reports” in the main menu.
- Select “Setup” or “Mistake” from the left-side menu.
Method 2: Filtering
- Use the main filter bar to select a specific setup or mistake.
- This filters the data across all TraderSync sections.
- Click “Reports” -> “Overview” for stats focused on that setup/mistake.
By consistently tracking your setups and mistakes, you unlock powerful insights that can significantly improve your trading performance. Start today to make data-driven decisions and enhance your trading strategy.
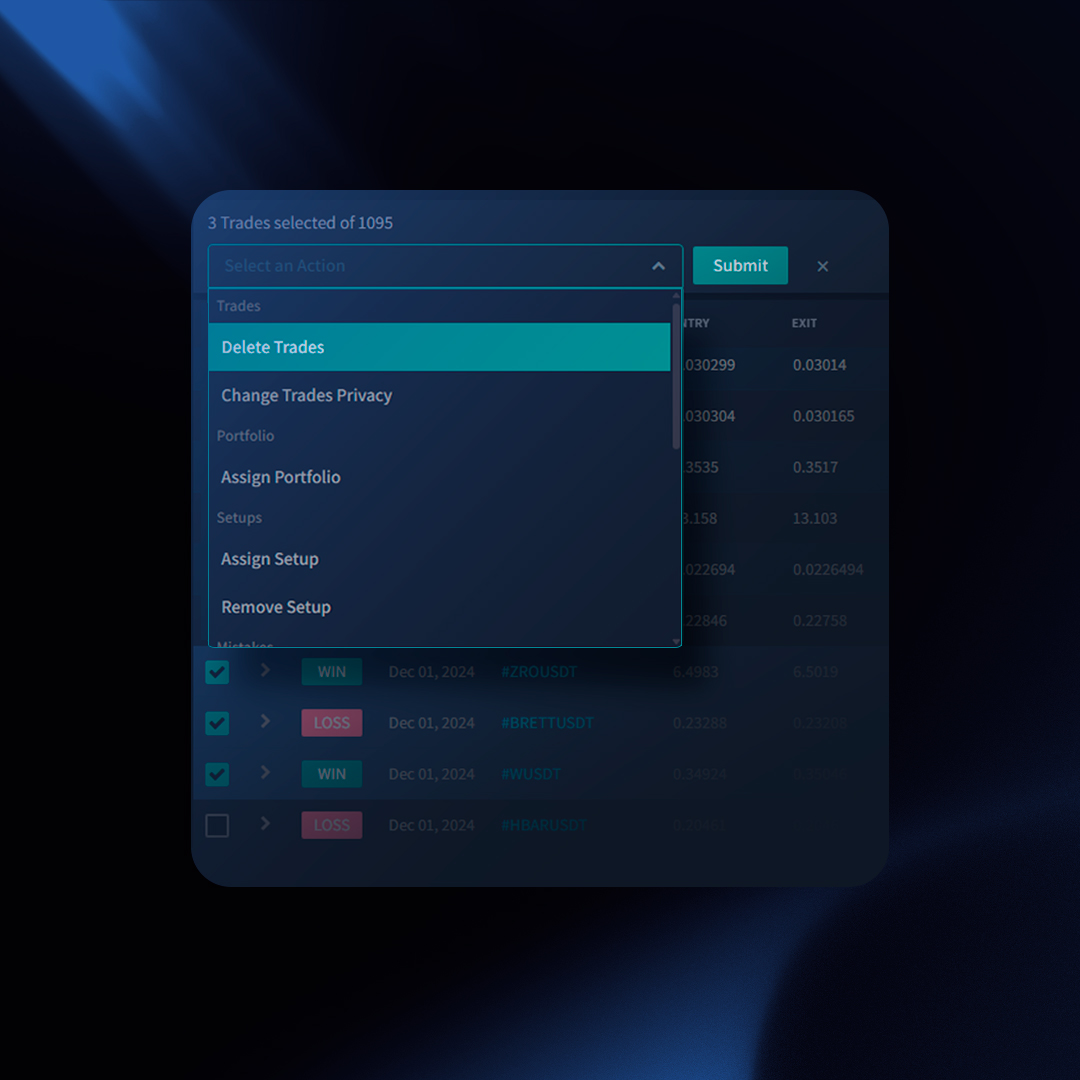
Save time and streamline your trade management with Bulk Actions. Quickly perform the following tasks on multiple trades at once:
Tagging for Analysis
- Assign Mistakes, Setups, Custom Tags: Categorize multiple trades in one step. Select the desired trades, then choose “Assign Setups / Mistakes / Custom Tags” from the Bulk Actions dropdown.
- Remove Mistakes, Setups, Custom Tags: Bulk remove tags to refine your analysis. Use the same process as above, but select “Remove…” instead.
Merging Trades
Combine related trades for a clearer view:
- Method 1: Trade-to-Trade: Select two trades of the same symbol, then choose “Merge Trades” from the Bulk Actions dropdown.
- Method 2: Executions-to-Trade:
- Go to the “Trades” page and expand the relevant trades.
- Select the executions to merge and the destination trade.
- Choose “Merge Trades” as before.
Other Actions
- Change Spread (Options): Select a trade, then “Change Spread” from Bulk Actions. Ideal for adjusting option trade details.
- Change Privacy: Select trades, then “Change Privacy” to toggle between “Public” and “Private”.
- Delete Trades: Select and use the “Delete Trades” option for permanent removal.
- Assign Portfolio: Select trades, then “Assign Portfolio” to re-categorize them.
Exporting Data
- Export Executions: Get execution-level data for trades matching your filters.
- Export Trades: Export summary-level trade data for trades matching your filters.
How to Use Bulk Actions
- Select the desired trades using checkboxes.
- Choose the action from the “Bulk Actions” dropdown menu.
- If needed, select specific options (like tags or privacy settings).
- Click “Submit.”
Tips
- Use filtering to precisely target the trades you want to modify.
- Bulk Actions can save significant time when managing a large number of trades.
Stop breaking your own trading rules! TraderSync’s Strategy Checker helps you pinpoint weaknesses, improve discipline, and boost your bottom line. See how consistently following your plan impacts your win rate. Uncover the specific rules that lead to your biggest gains and those you might need to rethink.
What is it?
The Strategy Checker is your trade-by-trade accountability system. Define your ideal trading rules as a checklist, then see which ones you consistently follow – and which you don’t.
The Benefit
Knowing which rules you consistently break or adhere to empowers you to make informed changes to your strategy and boost your trading performance.
Questions you will be able to answer
- Am I following my trading rules?
- Is there a significant performance difference between trades that follow all my rules versus those that don’t?
- Which rule am I frequently skipping that’s causing me to lose money?
Example
Let’s assume you’re trading the “Gap and Go” strategy with these rules:
Category: Technicals
- Rule 1: Gapped more than 3% premarket
- Rule 2: Trading premarket between $1 – $7
Category: Fundamentals
- Rule 1: Strong positive news
Category: Entry
- Rule 1: Daily breakout
- Rule 2: Strong volume
Category: Exit
- Rule 1: 5% stop loss
- Rule 2: 15% target
This strategy criteria should be created as a checklist for you to simply check which of these criteria were met when you opened the position.
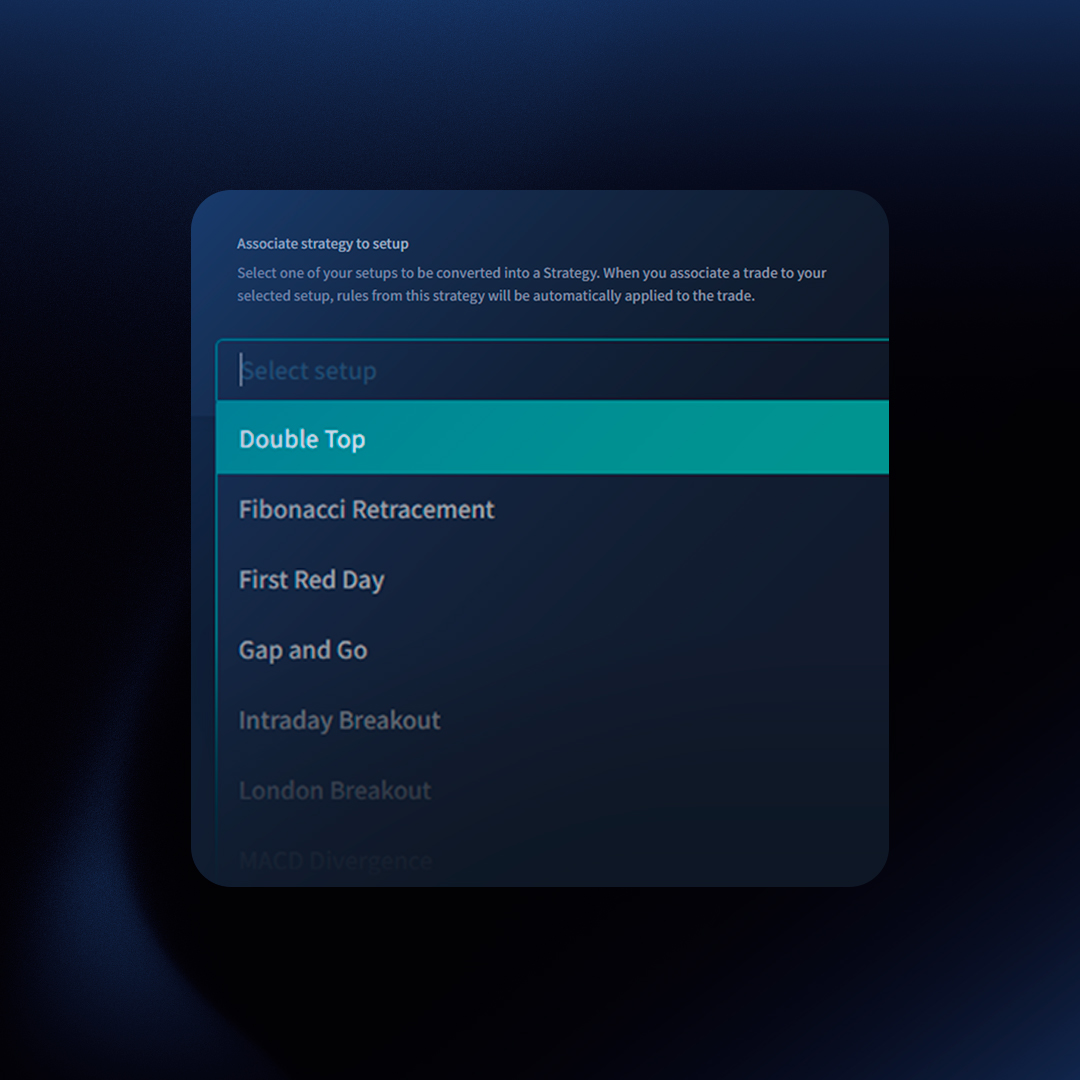
Creating a Strategy
- Click on “Strategies” from the left menu on TraderSync.
- Click on “Create Strategy.”
- Type a name and a description for your strategy (e.g., “Gap and Go”).
- Select a setup to associate from the dropdown. This allows you to easily assign a specific strategy to a single setup.
- You will be prompted to create your first category for rules. For example, “Entry Rules” could be a category. Under this category, define all entry criteria that the trade must meet for you to take the trade.
- You will now be redirected to create rules for the newly created Rules category. You can add your rules here (e.g., “Gapped more than 3% premarket”).
- Create as many categories and rules as your strategy requires. The idea is to build a checklist of criteria that need to be met for the strategy to signal an entry order.
Assigning a Strategy to Your Trades
- Click to open a trade.
- Click on the top where it says “Assign strategy.”
- Select the appropriate strategy from the dropdown menu.
- Start clicking on the checkbox next to each rule indicating which rules you followed.
That’s it! TraderSync will now show an indication of how many trade rules you followed from your strategy.
Suggestions
We suggest you create at least the following categories:
- Entry Conditions: Use this to determine which trades to take and which conditions need to be met for the trade to match your strategy.
- Exit Conditions: Use this to create rules to define when to exit this specific strategy, such as specific targets and stop losses.
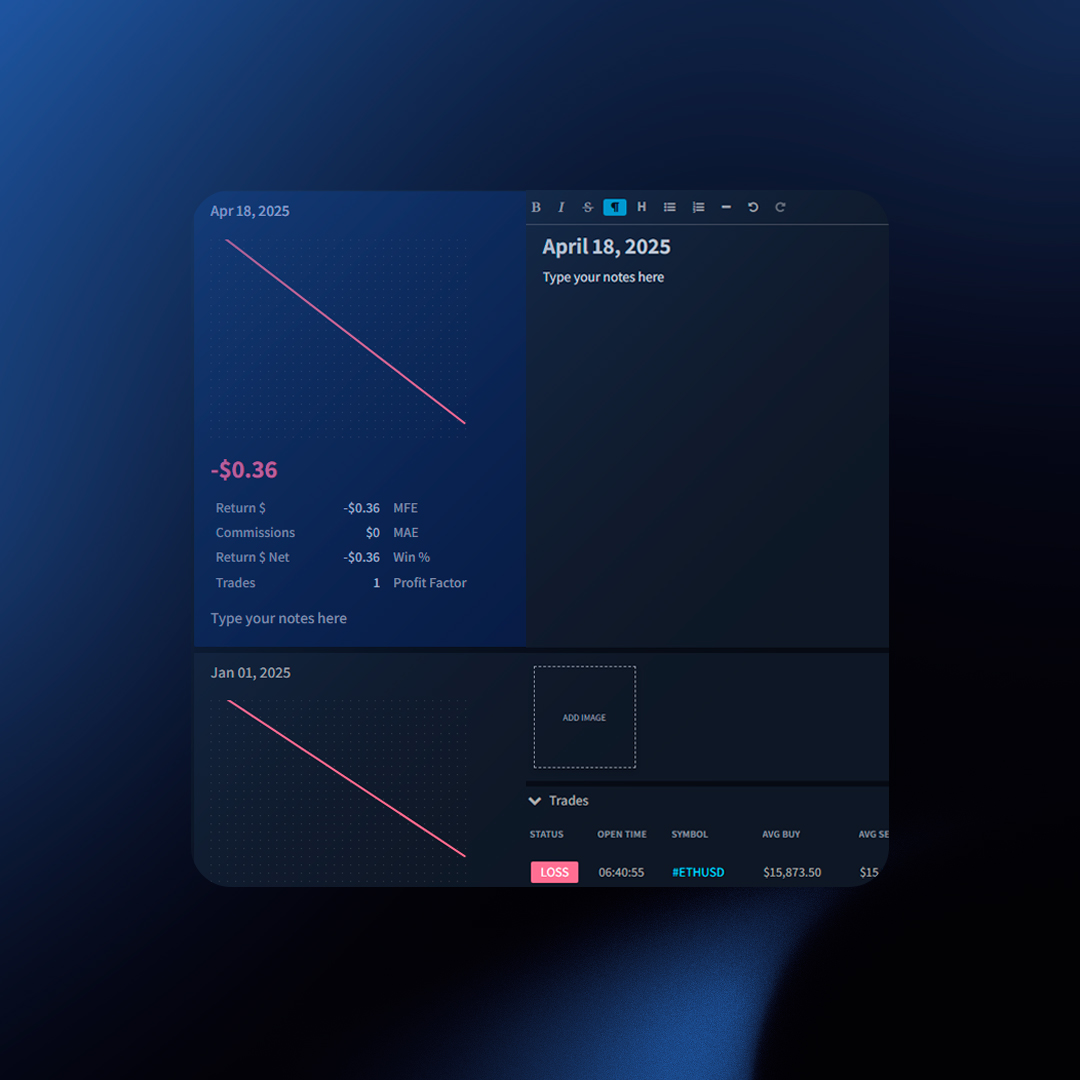
Your trading journal is more than a logbook – it’s a tool for understanding your thought process and identifying areas for growth. TraderSync’s journal section allows you to create detailed notes about your trading day. This feature is crucial as it enables you to capture your thoughts, review them later, and analyze how your performance aligns with your notes.
TraderSync combines customizable data with your daily reflections to provide valuable insights. You will see the trades you made each day, the analytics for each day, and a section where you can add notes. This section focuses on the notes.
Customizing Your Layout
Tailor the journal to display the information that matters most to you:
Left Panel Metrics
- Click the nine-dot icon in the panel’s top right corner.
- Toggle metrics on or off to focus on your key performance indicators.
Right Panel (Screenshots and Trades)
- Use the nine-dot icon to show or hide screenshots and trades associated with a daily entry.
Daily Stats
Each day you trade, you’ll see a summary box containing:
- Return $ Gross
- Return $ Net
- Commissions
- Trades
- MFE (Maximum Favorable Excursion)
- MAE (Maximum Adverse Excursion)
- Win %
- Profit Factor
- Daily Running PnL Graph
Understanding the Daily Running PnL
The Daily Running PnL graph tracks realized and unrealized gains/losses for closed trades throughout the day.
Example
Position 1 Running PnL: EURUSD:
- 01:00 PM – You opened a position
- 01:30 PM – You were up $50
- 02:00 PM – You were down -$150
- 03:00 PM – You closed the position for a loss of -$30
Position 2 Running PnL: BTCUSDT:
- 10:00 AM – You opened a position
- 11:00 AM – You were down -$50
- 01:30 PM – You were up $60
- 02:00 PM – You were up $10
- 03:00 PM – You closed the position for a gain of $20
The Daily Running PnL is calculated by algebraically adding the running PnL of both positions throughout the day.
Daily Running PnL Calculation:
| Time |
EURUSD |
BTCUSDT |
Running PnL |
| 11:00 AM |
0 |
-50 (unrealized pnl) |
-50 (0 – 50) |
| 01:30 PM |
50 (unrealized pnl) |
60 (unrealized pnl) |
110 (50 + 60) |
| 02:00 PM |
-150 (unrealized pnl) |
10 (unrealized pnl) |
-20 (-150 + 10) |
| 03:00 PM |
-30 (realized pnl) |
20 (realized pnl) |
10 (-30 + 20) |
The running PnL Graph will be formed out of the following data:
- 11:00 AM | -50
- 01:30 PM | +110
- 02:00 PM | -20
- 03:00 PM | +10
Key Points
- Daily Running PnL focuses on closed trades.
- It reflects gains/losses while the position was open, not your current market position.
- It combines results across all accounts (filters can be applied).
Adding Notes On Non-Trading Dates
You can also add notes on non-trading dates. To do this:
- Click the “Add Note” icon at the top.
- Select a date and write your notes.
Get ready to unlock a whole new level of trade analysis with TraderSync’s revolutionary Custom Filtering feature! Gone are the days of limited filtering options. Now, you can explore your trading history with the precision of a custom query builder, all wrapped in a user-friendly interface.
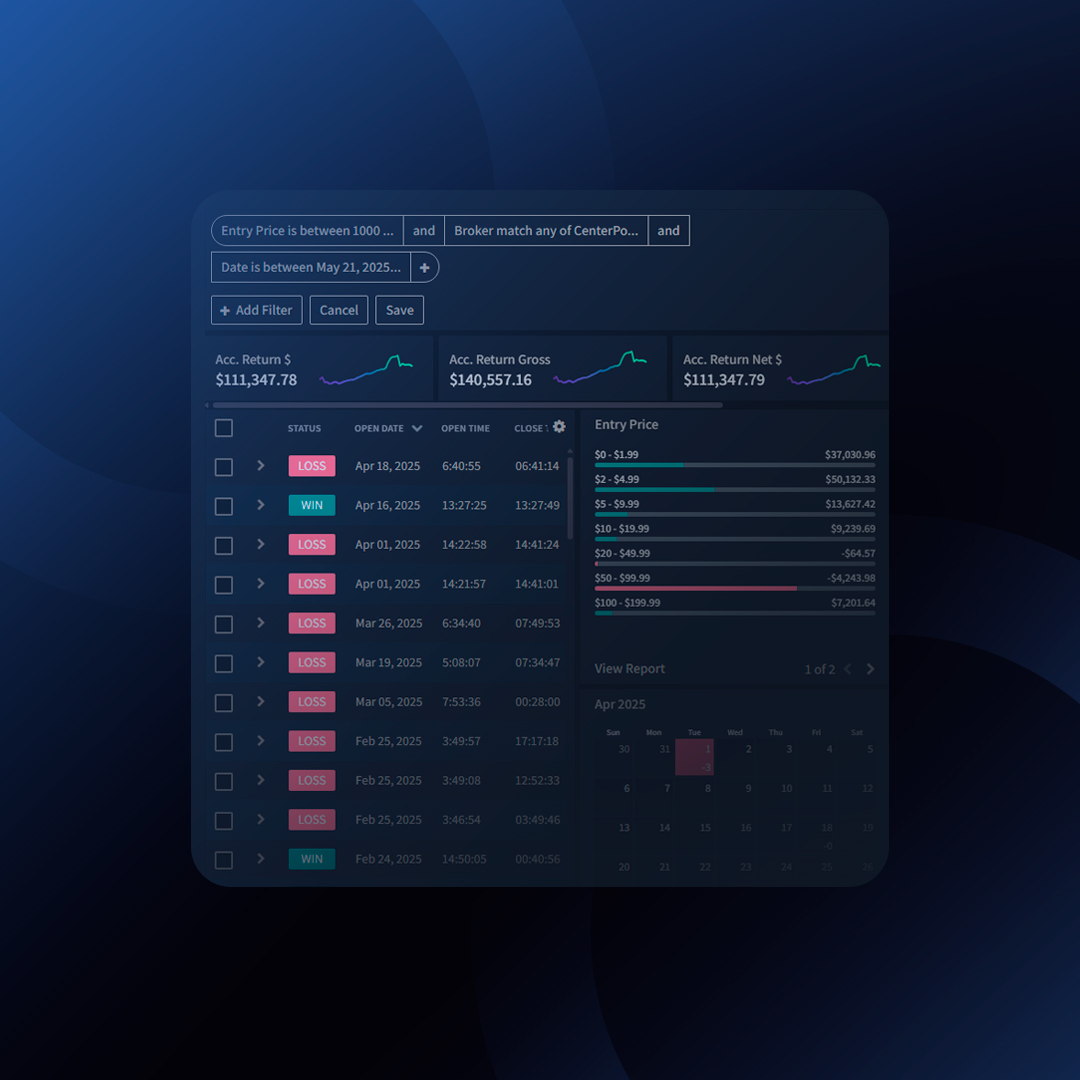
What is Custom Filtering?
Imagine a world where you can filter your trades based on any combination of criteria – a world where you’re not restricted to predefined options. This is the power of Custom Filtering! Build intricate filter sets that target exactly the trades you want to analyze.
Unprecedented Flexibility
- Go Beyond Basic Filters: Standard filtering by single criteria is a thing of the past. Now you can combine multiple filters using AND/OR logic to create highly specific queries.
- Uncover Hidden Insights: Discover patterns and trends that were previously obscured by limitations. Unearth valuable lessons from your trading history.
- Tailored Analysis: Craft filters that perfectly match your unique trading style and analysis goals.
User-Friendly Power
Don’t be intimidated by the word “custom.” TraderSync’s Custom Filtering is designed with simplicity in mind.
- Intuitive Interface: Build complex filters with ease using our user-friendly dropdown menus and selection options.
- No Coding Required: Forget complex query languages! TraderSync empowers you with a visual approach to filter creation.
- Focus on Analysis: Spend less time wrestling with filters and more time extracting valuable insights from your data.
A World of Possibilities
Imagine filtering for trades that meet these criteria:
- Setup: Morning Breakout
- Mistake: Entered Against the Trend
- Day of Week: Not Tuesday
- Result: Profitable
With Custom Filtering, this scenario and countless others become a reality. Gain a deeper understanding of your trading behavior and identify areas for improvement.
Embrace the Future of Trade Analysis
TraderSync’s Custom Filtering is a game-changer for any trader who wants to take their analysis to the next level. With unmatched flexibility and user-friendly design, it’s the perfect tool to unlock the full potential of your trading data.
Ready to unleash the power of custom filtering? Start exploring TraderSync today!
 Labor Day Sale — Up To 50% Off