When you close a position with multiple entries (scaling in/out), how your profit/loss is calculated matters. TraderSync offers three methods: FIFO, LIFO, and Weighted Average. These impact your trade detail page, especially the partial gains for each execution.
Intro to the Methods
- FIFO (First In, First Out): Assumes you sell your earliest purchased shares first. Common for tax purposes.
- LIFO (Last In, First Out): Assumes you sell your most recently purchased shares first. Less common in trading.
- Weighted Average: Calculates an average purchase price across all entries, then uses that for exits.
Example
Impact on Partial Gains
Let’s say you:
- Buy 100 shares at $10
- Buy 100 shares at $12
- Sell 100 shares at $15
Here’s how the partial gain on that sale is calculated differently:
- FIFO:
- Assume you sold the $10 shares first
- Partial Gain: $500 (100 shares * ($15 – $10))
- LIFO:
- Assume you sold the $12 shares first
- Partial Gain: $300 (100 shares * ($15 – $12))
- Weighted Average:
- Average Entry Price: $11 ((100 * $10) + (100 * $12)) / 200 shares)
- Partial Gain: $400 (100 shares * ($15 – $11))
Formulas
- FIFO: Partial Gain = (Exit Price – Price of Earliest Shares) * Quantity Sold
- LIFO: Partial Gain = (Exit Price – Price of Latest Shares) * Quantity Sold
- Weighted Average:
- Avg Entry Price = (Total Entry Cost) / (Total Shares)
- Partial Gain = (Exit Price – Avg Entry Price) * Quantity Sold
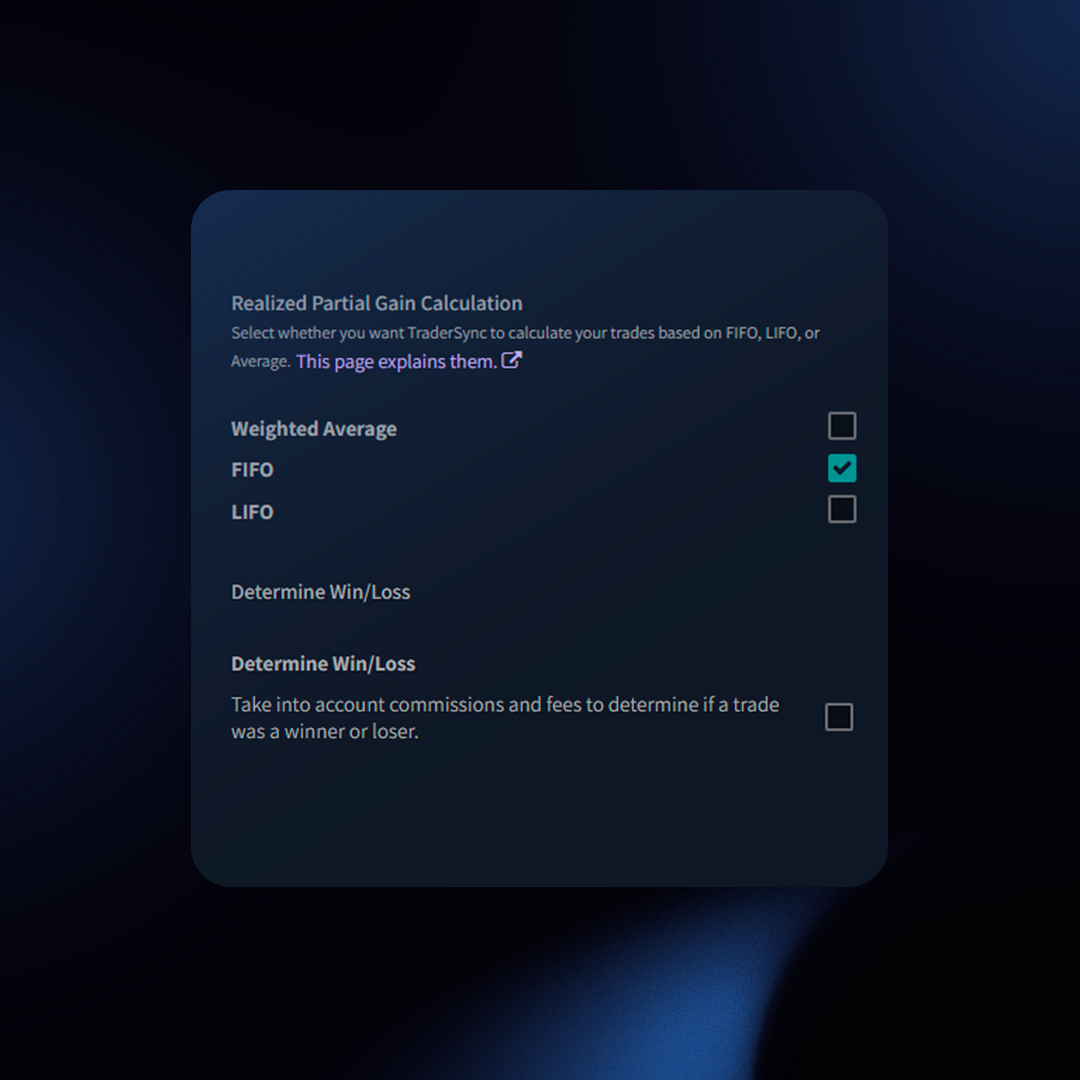
Changing Your Setting in TraderSync
- Go to the Configuration page (bottom left icon)
- Under “Trades“, find “Realized Partial Gain Calculation“
- Select your method (FIFO, LIFO, Weighted Average)
- TraderSync will recalculate your partial PnLs.
Which Method is Right?
There’s no single “best” method. Consider your tax situation, trading style, and the insights you want. Experiment to see how each method impacts your trade analysis.
Choosing the right tools to refine your trading strategies is crucial for success. TraderSync equips you with two powerful features: Backtesting and Market Replay. While they might seem similar at first glance, these features offer distinct benefits tailored to different testing approaches.
Here’s a breakdown to help you understand the key differences:
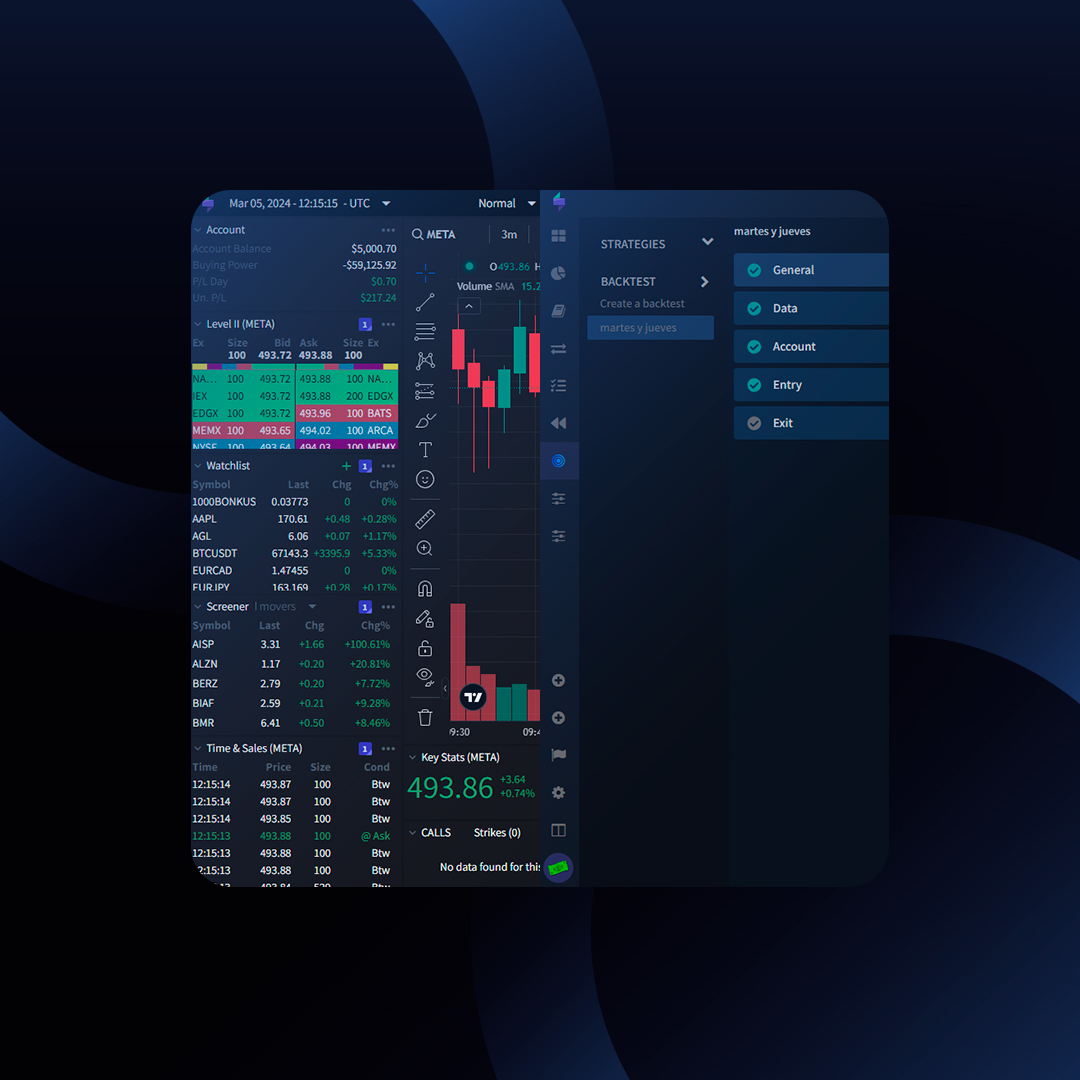
Backtesting: Automated Testing with Historical Data
- What it is: Backtesting simulates how a trading strategy would have performed on historical data.
- How it works: You define entry and exit criteria for your strategy using technical indicators or other filters. The system then automatically “trades” these criteria against historical data, providing performance metrics like P&L and win rate.
- Benefits: Backtesting allows you to efficiently test a large number of strategies on a variety of market conditions. It’s ideal for developing and refining rule-based, systematic trading approaches.
- Limitations: Backtesting cannot account for unforeseen market events or the emotional aspects of live trading. Furthermore, it may not be suitable for discretionary traders who rely on human judgment.
Market Replay: Hands-On Practice with Real Market Data
- What it is: Market Replay allows you to “replay” historical market data bar-by-bar, replicating the experience of live trading.
- How it works: You select a specific historical period and use your trading platform interface to manually enter or exit trades. This allows you to test your strategy while experiencing the emotions and market dynamics of real-time trading.
- Benefits: Market Replay provides a valuable practice environment for refining your trading skills and building confidence. It’s particularly beneficial for discretionary traders who rely on intuition and adaptability in the markets. Additionally, the ability to fast-forward through periods of inactivity or losses allows for efficient practice.
- Limitations: Market Replay requires manual effort and is time-consuming compared to backtesting. It also lacks the ability to analyze large datasets or test numerous variations of a strategy.
Choosing the Right Tool for You
The ideal tool depends on your trading style:
- Systematic Traders: If you rely on well-defined rules and technical indicators, Backtesting offers a fast and efficient way to test and refine your strategy.
- Discretionary Traders: If you rely on intuition and adapt your approach based on market conditions, Market Replay provides a realistic practice environment to hone your skills.
TraderSync: Empowering Your Trading Journey
Whether you’re a seasoned trader or just starting out, TraderSync’s Backtesting and Market Replay features provide powerful tools to develop and refine your trading strategies. By understanding the strengths and weaknesses of each approach, you can choose the best tool to fit your trading style and optimize your path to trading success.
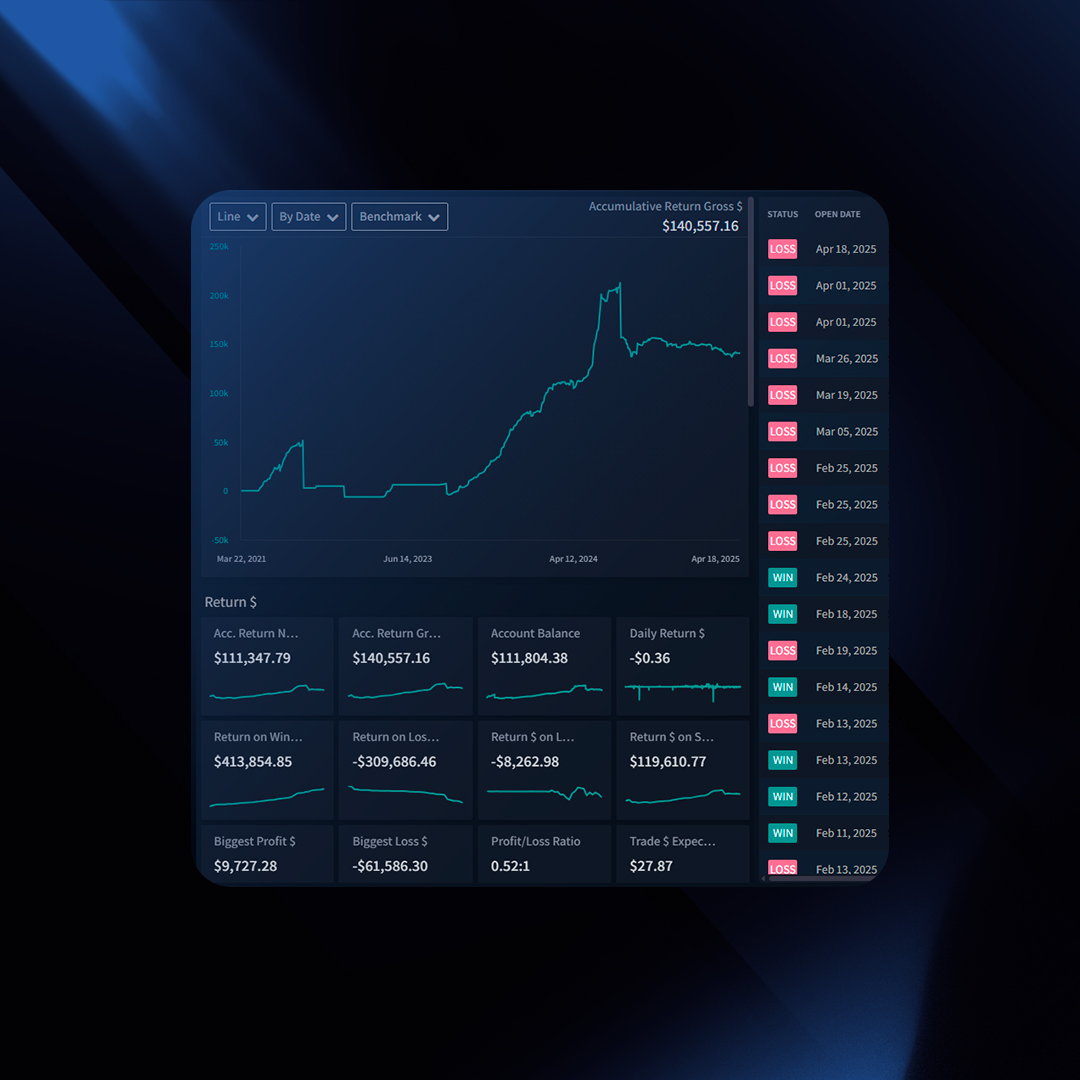
Go beyond basic PnL reviews to uncover hidden trading patterns that can help you adjust your trading strategy. TraderSync offers pre-made reports that break down your data into manageable sections, often called ‘buckets’, revealing areas for growth.
Key Reports
Some of the key reports include, but are not limited to:
- Timeframes (Hourly, Weekday, etc.).
- Entry Price, Volume, Status (Winners/Losers).
- Side (Long/Short), Spread (Options), Symbol, Call/Put.
- Setups, Mistakes, Custom Tags, and more.
Benefits
These pre-made reports allow you to easily identify patterns in your trading data, helping you make informed decisions.
Interpreting the Results
Example:
Reviewing the hourly report, we can quickly visualize that trading on Fridays results in losses. This suggests reconsidering trading on Fridays to avoid these losses.
Day of the Week Performance:
| Day of Week |
Return |
| Monday |
$44,000 |
| Tuesday |
$20,000 |
| Wednesday |
$10,000 |
| Thursday |
$13,000 |
| Friday |
-$22,000 |
The takeaway here is to possibly avoid trading on Fridays. Let’s dig deeper to see if there’s more to learn from this report.
Using Overlays
Overlays allow you to layer other important metrics on the pivot table to assess the effectiveness of your trading.
Example:
Overlaying the profit factor:
Day of the Week Performance with Profit Factor:
| Day of Week |
Return |
Profit Factor |
| Monday |
$44,532 |
1.5 |
| Tuesday |
$20,000 |
3.2 |
| Wednesday |
$10,000 |
1.2 |
| Thursday |
$13,000 |
1.3 |
| Friday |
-$22,000 |
-1.8 |
With this information, we see that while Monday appears to be the most profitable day, Tuesday’s profit factor is almost double that of Monday. This suggests that the quality of trades on Tuesday is better, indicating a bigger opportunity to explore Tuesday trades further.
Overlays help visualize potential correlations, enhancing the understanding of your trading effectiveness.
Overlay these graphs on top of your PnL chart for powerful insights:
- PnL
- Profit Factor
- Traded Quantity
- Number of Mistakes
- Number of Trades
Insights: Your Data-Driven Trading Coach
Think of TraderSync as a tireless analyst, sifting through your data to pinpoint strengths and weaknesses.
Example
Imagine TraderSync discovers you have exceptional results trading a “Day Breakout” setup on Tuesdays, specifically during morning hours. This kind of pattern is difficult to find manually, but our system surfaces it automatically, saving you time and effort.
Drill Down for Deeper Insights
Need to investigate further? Each bucket in a report can be drilled down into. Clicking a bucket (like the 10AM bar in the Hourly Report) applies that as a filter. You can then analyze other reports and metrics with that 10AM filter, giving you unlimited angles for exploration.
Think of your Trade Details page as a trading journal entry. Each trade has a story, and this is where you’ll find all the details – your motivations, execution, and the ultimate outcome. It’s a powerful tool for reviewing past trades, refining your strategies, and identifying patterns that drive your success or losses.
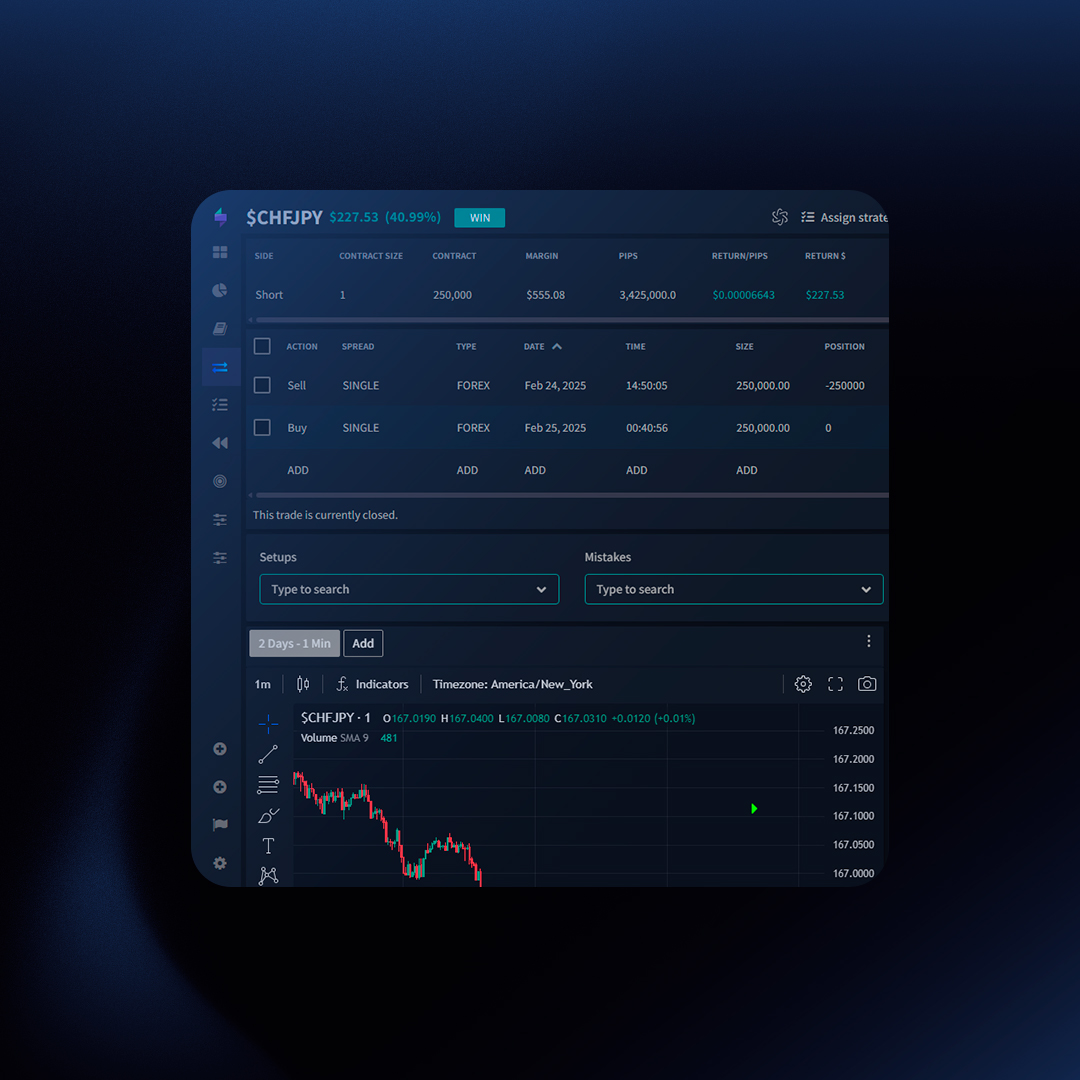
Key Features of the Trade Details Page
- Executions: See every individual buy and sell that made up the trade
- Tags (Setups, Mistakes, Custom): Understand why you entered the trade and potential errors you made
- Chart with Execution Markers: Visualize your entry, exit, targets, and stop-losses in the context of price action.
- Running P&L: Track how your profit or loss fluctuated throughout the position’s lifespan.
- Exit Analysis (Rolling Analysis): See how your profit would have changed if you exited at different intervals (e.g., +5 minutes, +10 minutes).
- Notes and Screenshots: Record your thoughts, observations, and capture visual references.
- Metrics: Get a comprehensive view of the trade’s P&L, return percentage, R-Multiple, expectancy, portfolio, cost, size, and more.
Make it Your Own: Customization Options
- Layouts: Choose between “Balanced” (equal focus on data and chart) or “Chart Focus” views.
- Activate Trades List: Navigate between trades quickly without returning to the dashboard.
- Manage Blocks: Rearrange or hide content blocks to focus on what matters to you.
How to Access and Share
- Finding a Trade: Search via the Trades section, or access it directly from the Dashboard.
- Sharing and Privacy: Create shareable links for feedback, but protect your data by toggling privacy settings.
Extra Feature: Assign a Strategy
Link a trade to a pre-defined trading strategy checklist. This lets you track which rules you’re following (or not!) and pinpoint those impacting your performance.
Ready to Dive Deeper?
Unlock the full potential of your Trade Details page to become a more informed and successful trader.
Trades are the core data you must input into TraderSync.It is important to keep your trades up to date so we can build accurate reports for you.
Adding Trades
TraderSync offers three flexible ways to input your trading data:
How To Syncing Trades
To check if your broker/exchange supports syncing with TraderSync click here and refer to the column “Auto Sync”:
How to Sync
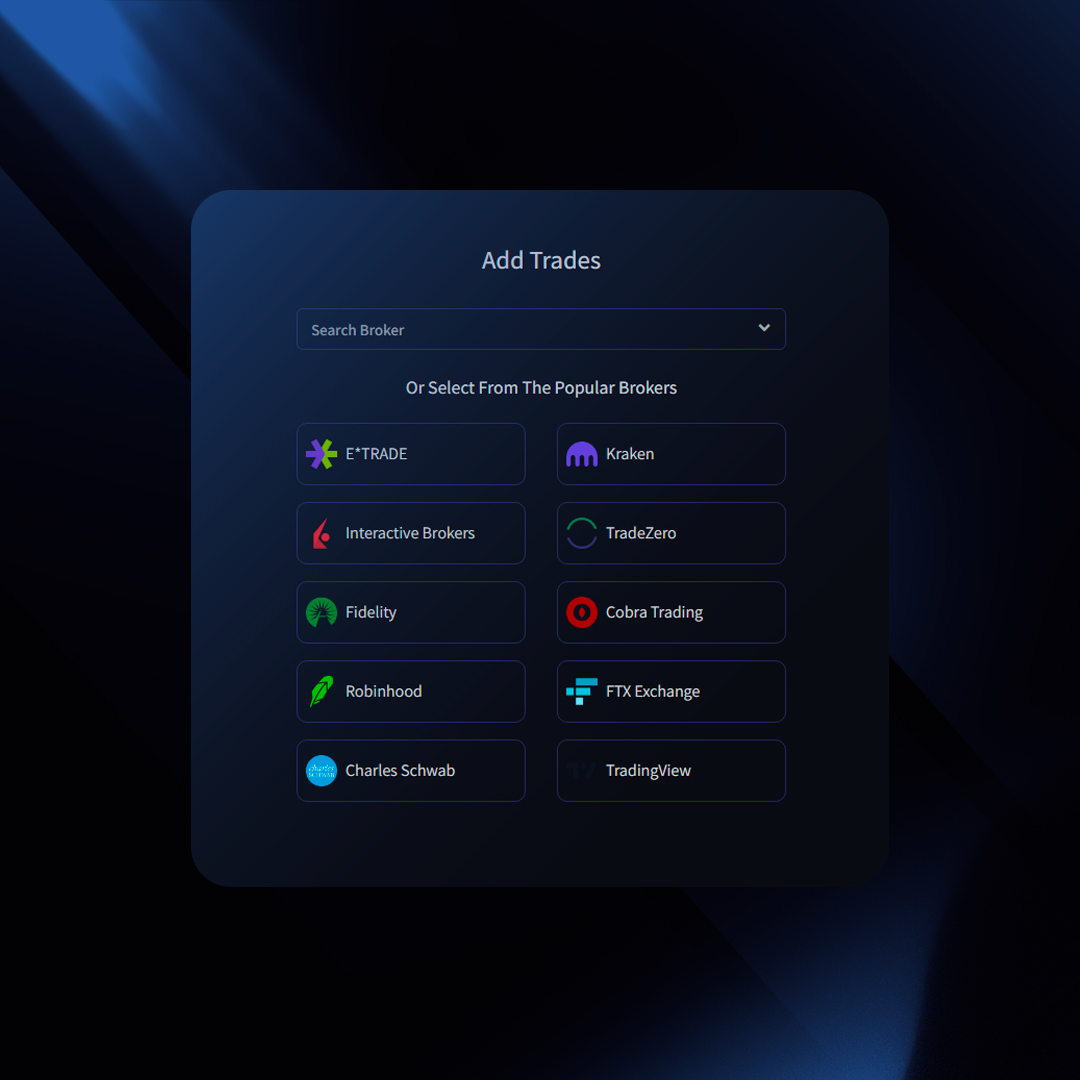
- Click “Add Trades” (top right)
- Select “Synchronization” (left menu)
- Choose your broker from the dropdown
- Follow the on-screen instructions.
- Click “Import Trades“
Important Notes
- To fetch new trades, click “Import” again (not automatic).
- If you place an order now, it might take up to 24 hours for the broker to allow the trade to be able to be synced
Import Trades via File
To check if your broker/exchange trade statements are supported by TraderSync, click here and refer to the columns for Stocks, Options, Futures, Forex, and Crypto to determine which assets are supported.
How to Import:
- Click “Add Trades” (top right)
- Select “Import” (left menu)
- Choose your broker from the dropdown
- Follow the on-screen instructions.
- Click “Import Trades“
Manually Typing Trades
For maximum control or unsupported brokers, enter trades manually:
Method 1: Manual Form
- Click “Add Trades” (top right)
- Select “Manual Entry” (left menu)
- Fill in the form
- To add multiple executions at once, click “Add Executions” before saving.
Method 2: Trade Detail Page
- Find the trade (Dashboard or Trades page) and click to open.
- In the “Balance” view, click “ADD” under the existing executions.
- Fill in details, then click the plus icon to save.
Editing Executions
- Find the trade and open its detail page (“Balance” view).
- Click directly on the value you wish to change (e.g., the date)
- Edit the information and save.
Editing Trades
- Find the trade (Dashboard or Trades page) and click to open.
- Click on the data that you want to Edit such as (Action, Spread, Date, Time, Size, Price, Commissions, and Fees). Upon editing the value and clicking outside the changes will be saved.
Deleting Trades
- Find the trade (Dashboard or Trades page).
- Select the trades using the checkbox on the left side of the trades table.
- Select “Delete Trades” from the bulk action dropdown menu.
- Click “Submit”.
Deleting Executions
- Find the trade (Dashboard or Trades page) and click to open.
- In the “Balance” view, click the checkbox on the left of the execution(s) to select it.
- Select “Delete Orders” from the bulk action dropdown menu.
- Click “Submit”.
 Labor Day Sale — Up To 50% Off