Have you ever wondered:
- Did I exit too early? Too late?
- How much was I down during my trade?
- How much was I up during my trade?
- Could holding my positions longer drive me more profit?
- What would have been the best possible exit?
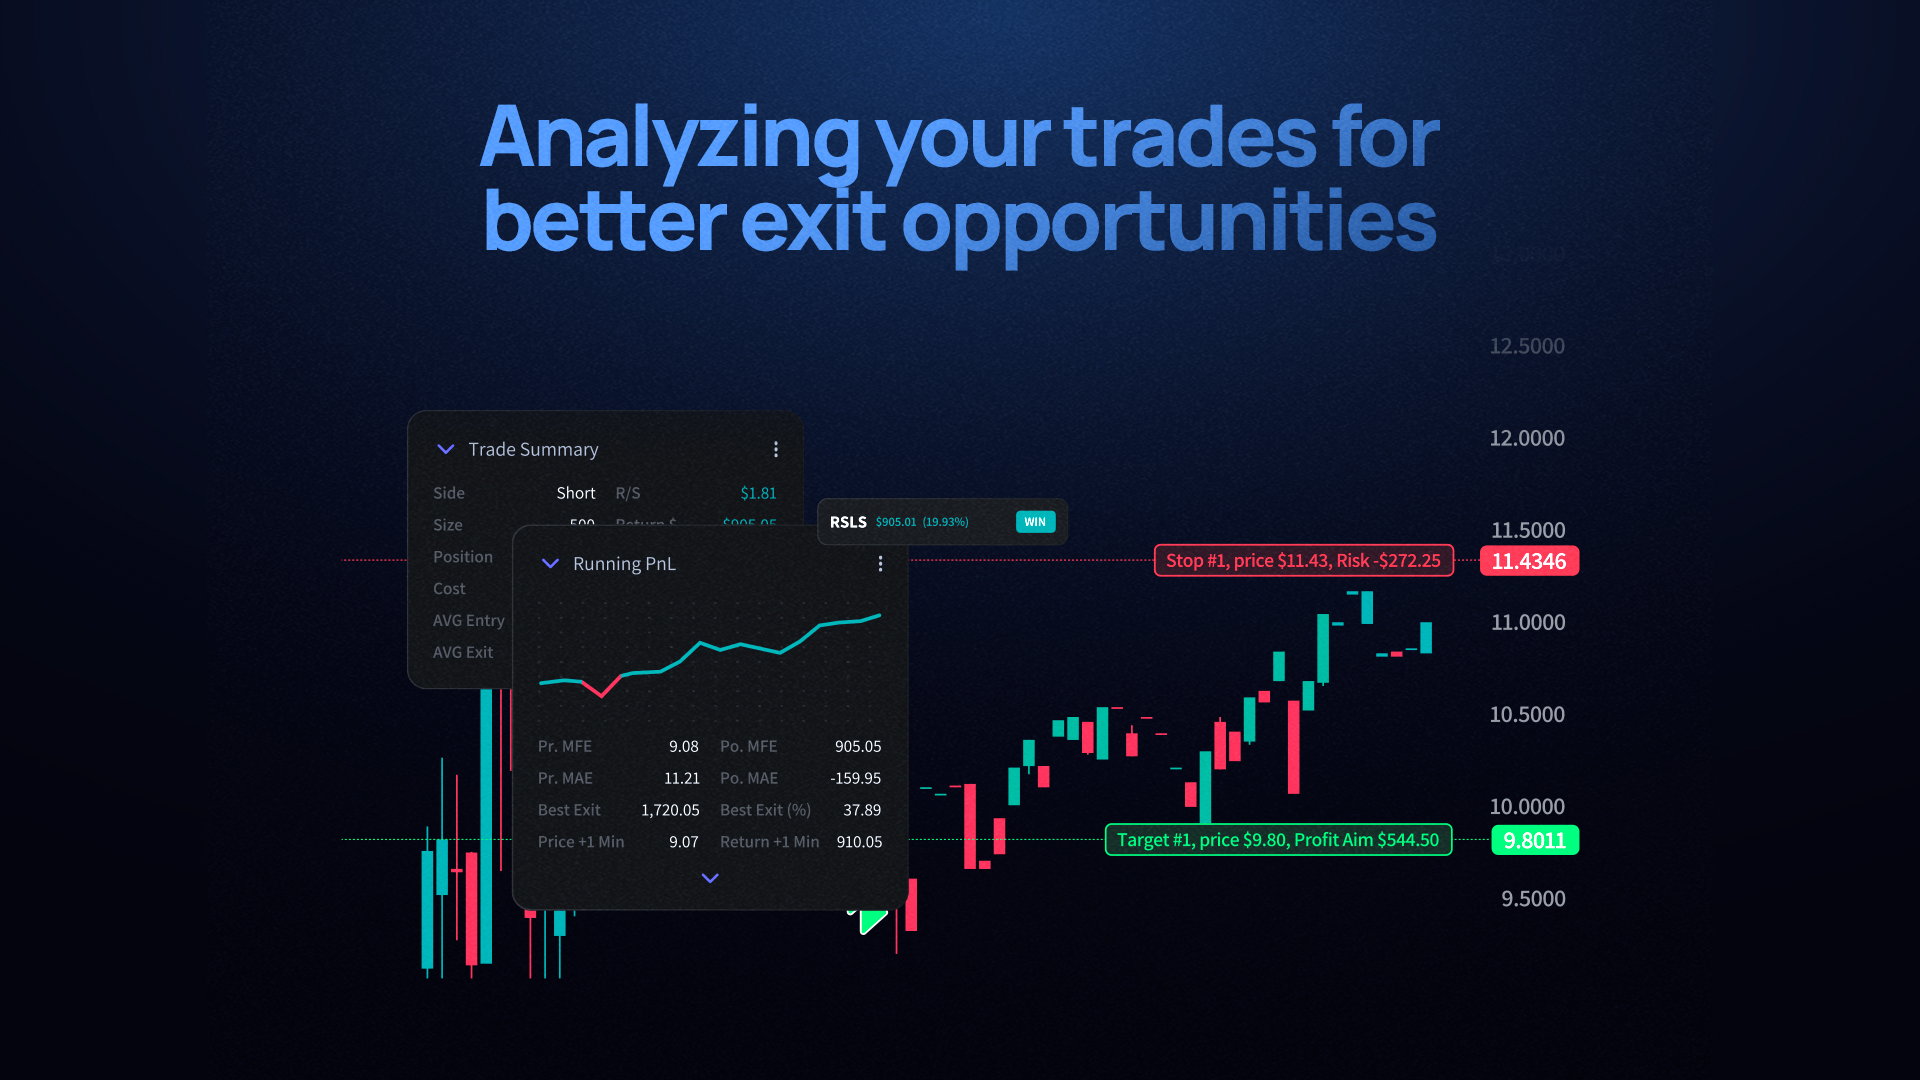
In this guide, we will review how TraderSync’s simple-to-digest reports help you quickly answer these questions and more.
Before we attempt to answer these questions, it is important to understand the following metrics provided by TraderSync, as we will use them to answer the questions above:
- Price MAE (Maximum Adverse Excursion)
- Price MFE (Maximum Favorable Excursion)
- Position MFE (Maximum Favorable Excursion)
- Position MAE (Maximum Adverse Excursion)
- Best Exit (Last Execution)
- Rolling Exits
Price MAE (Maximum Adverse Excursion)
Definition
Price MAE represents the maximum adverse price movement against a trade position before the trade is closed. It measures the worst price change.
Methodology
- Long Trade: Represents the lowest price between the opening and closing execution of the trade.
- Short Trade: Represents the highest price between the opening and closing execution of the trade.
Example
Let’s assume the following:
- Sell – 100 Shares – AVGR – 17:50:00 – $12.90
- Buy – 100 Shares – AVGR – 18:24:00 – $13.13
The example illustrates a short trade. Between 17:50:00 and 18:24:00, the worst price was $13.63, as this is the highest price the underlying reached during the trade. For a short trade, a higher price means a greater loss.
Significance for Day Traders
Day traders use Price MAE to assess potential risk and set stop-loss orders. It helps traders understand the maximum unfavorable price movement they might encounter during a trade.
Price MFE (Maximum Favorable Excursion)
Definition
Price MFE is the maximum favorable price movement in favor of a trade position before the trade is closed. It measures the peak profit potential of a trade.
Methodology
- Long Trade: Represents the highest price between the opening and closing execution of the trade.
- Short Trade: Represents the lowest price between the opening and closing execution of the trade.
Example
Let’s assume the following:
- Sell – 100 Shares – AVGR – 17:50:00 – $12.90
- Buy – 100 Shares – AVGR – 18:24:00 – $13.13
In this short trade example, between 17:50:00 and 18:24:00, the best price was $12.70. For a short trade, a lower price means a higher profit.
Significance for Day Traders
Day traders use Price MFE to evaluate the profit potential of a trade. It aids in setting profit targets and understanding how much price movement was in their favor during the trade.
Position MFE (Maximum Favorable Excursion)
Definition
Position MFE is the sum of the maximum favorable return during the trade based on the Price MFE. It tells you the peak profit reached during the trade and should equal the highest point of your running PnL.
Example
Let’s assume the following:
- Sell – 100 Shares – AVGR – 17:50:00 – $12.90
- Buy – 100 Shares – AVGR – 18:24:00 – $13.13
If you had exited at $12.70 instead of $13.13, your profit would have been $20 (100 shares x ($12.70 – $12.90)) instead of $23 (100 shares x ($13.13 – $12.90)).
Significance for Day Traders
This metric helps day traders assess their ability to capture favorable price movements. It is particularly useful for evaluating the overall MFE performance of all trades for a particular trading strategy, helping to identify opportunities to increase profits by adjusting exit strategies.
Position MAE (Maximum Adverse Excursion)
Definition
Position MAE is the sum of the maximum adverse return during the trade based on the Price MAE. It tells you the worst loss reached during the trade and should equal the lowest point of your running PnL.
Example
Let’s assume the following:
- Sell – 100 Shares – AVGR – 17:50:00 – $12.90
- Buy – 100 Shares – AVGR – 18:24:00 – $13.13
If you had exited at $13.63, your loss would have been $73 (100 shares x ($13.63 – $12.90)) instead of $23 (100 shares x ($13.13 – $12.90)).
Significance for Day Traders
Day traders use Position MAE to evaluate the overall risk exposure of a particular trade. It helps understand the overall risk of your strategy and determine if adjustments are needed.
Best Exit (Last Execution)
Definition
Represents the best possible overall return you could have made on the trade by moving the last exit execution to the optimal point between the previous same-side execution and the end of the day.
Example
Let’s assume the following:
- Sell – 100 Shares – SERA – 09:44:00 – $4.87
- Buy – 100 Shares – SERA – 09:45:14 – $5.10
In this long trade, if the best possible exit before the end of the day was at 10:20:00 when the price was $11.66, the best possible return would have been $679 (100 shares x ($11.66 – $4.87)) instead of just $23.
Rolling Exits Analysis
Definition
Helps you determine if there exists an opportunity to hold your positions longer for a better overall return.
Methodology
We remove the last execution and move it forward, analyzing each minute candle until the end of the day. For swing trades, we analyze daily candles.
Example
Let’s assume the following:
- Buy – 100 Shares – SERA – 09:44:00 – $4.87
- Sell – 100 Shares – SERA – 09:45:14 – $5.10
We will move forward the last execution to analyze each candle. This will generate an output similar to:
- Exiting 5 minutes later would have produced $196 in profits instead of just $91.
- Exiting 10 minutes later would have produced $248 in profits instead of just $91.
- Exiting 1 hour later would have produced $1,444 in profits instead of just $91.
This analysis is particularly helpful when looking at aggregated results among your trades. You can answer questions like:
“If I hold all my positions for my strategy X for 5 more minutes, would that create a significant impact on my trading performance?”
A few things to consider when evaluating rolling exits:
- Acceptable Risk: We will stop checking candles forward if either your defined risk or max drawdown on the trade is greater than the current candle. We will take the higher value.
Recap
Circling back to the value of these exit analysis reports, we are looking to answer the questions we initially outlined:
How much was I down during my trade?
You can use the Position MAE to understand the worst PnL during the trade. This helps:
- Ensure you are sticking to your max risk per trade.
- Understand your current risk tolerance while on a trade.
- Determine if there is an opportunity to take on more risk to possibly maximize your R Multiple.
How much was I up during my trade?
You can use the Position MFE to understand the peak PnL during the trade. This helps:
- Ensure you are sticking to your plan in terms of respecting your targets.
- Determine if there is an opportunity for a better exit if the Position MFE is significantly higher than your actual return on the trade.
What would have been the best possible exit?
Using the Best Exit metric, you can know what would have been the best possible exit for your specific trade. This metric gives you an idea of how efficient your strategy is, though consistently capturing the best exit is challenging.
Could holding my positions longer drive me more profit?
The Rolling Exits analysis can help determine if there is an opportunity to hold your positions longer for a specific timeframe to maximize your return.
We hope these tools help you evaluate the exit rules of your trading strategy to optimize the potential R Multiple return.