Your trading journal is more than a logbook – it’s a tool for understanding your thought process and identifying areas for growth. TraderSync’s journal section allows you to create detailed notes about your trading day. This feature is crucial as it enables you to capture your thoughts, review them later, and analyze how your performance aligns with your notes.
TraderSync combines customizable data with your daily reflections to provide valuable insights. You will see the trades you made each day, the analytics for each day, and a section where you can add notes. This section focuses on the notes.
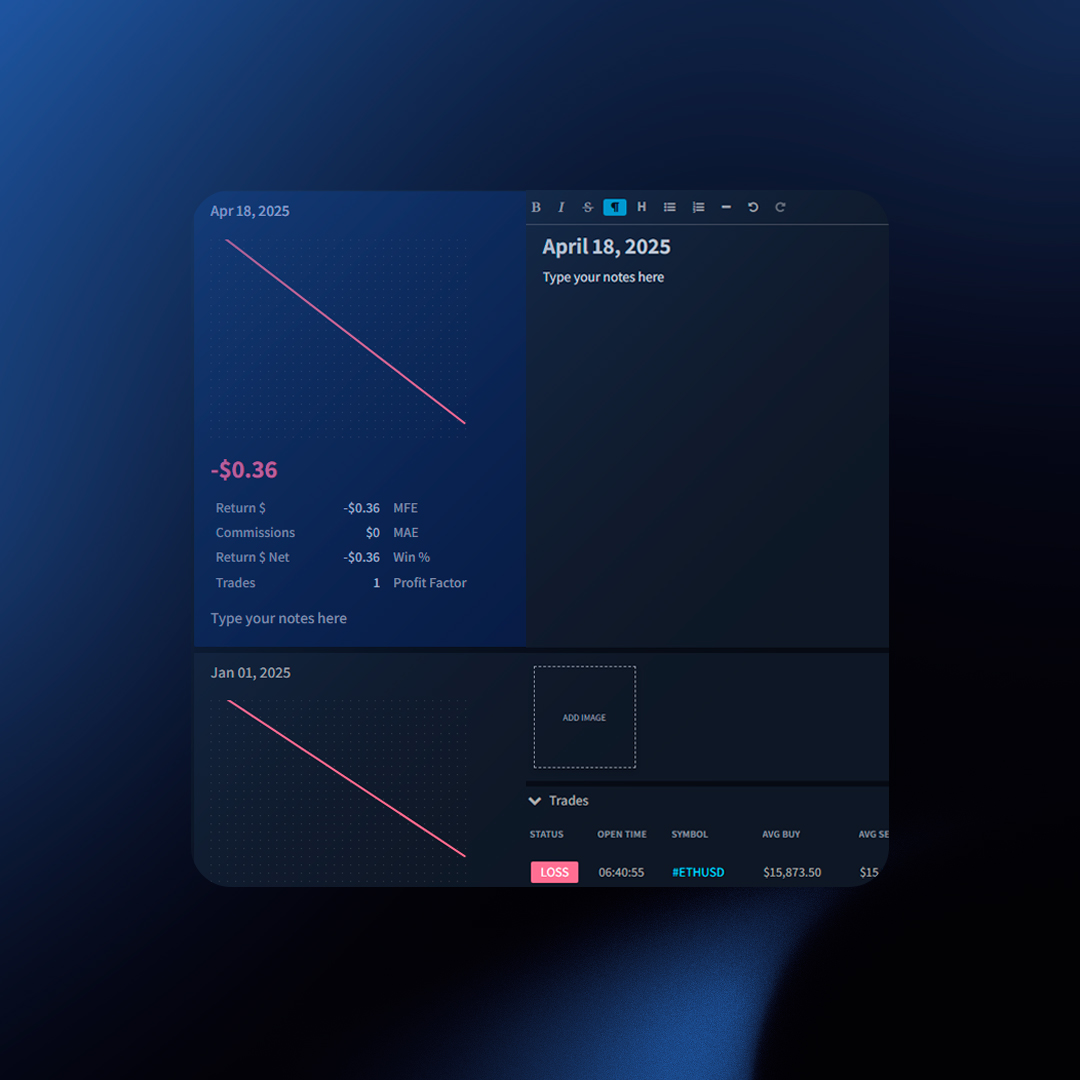
Customizing Your Layout
Tailor the journal to display the information that matters most to you:
Left Panel Metrics
- Click the nine-dot icon in the panel’s top right corner.
- Toggle metrics on or off to focus on your key performance indicators.
Right Panel (Screenshots and Trades)
- Use the nine-dot icon to show or hide screenshots and trades associated with a daily entry.
Daily Stats
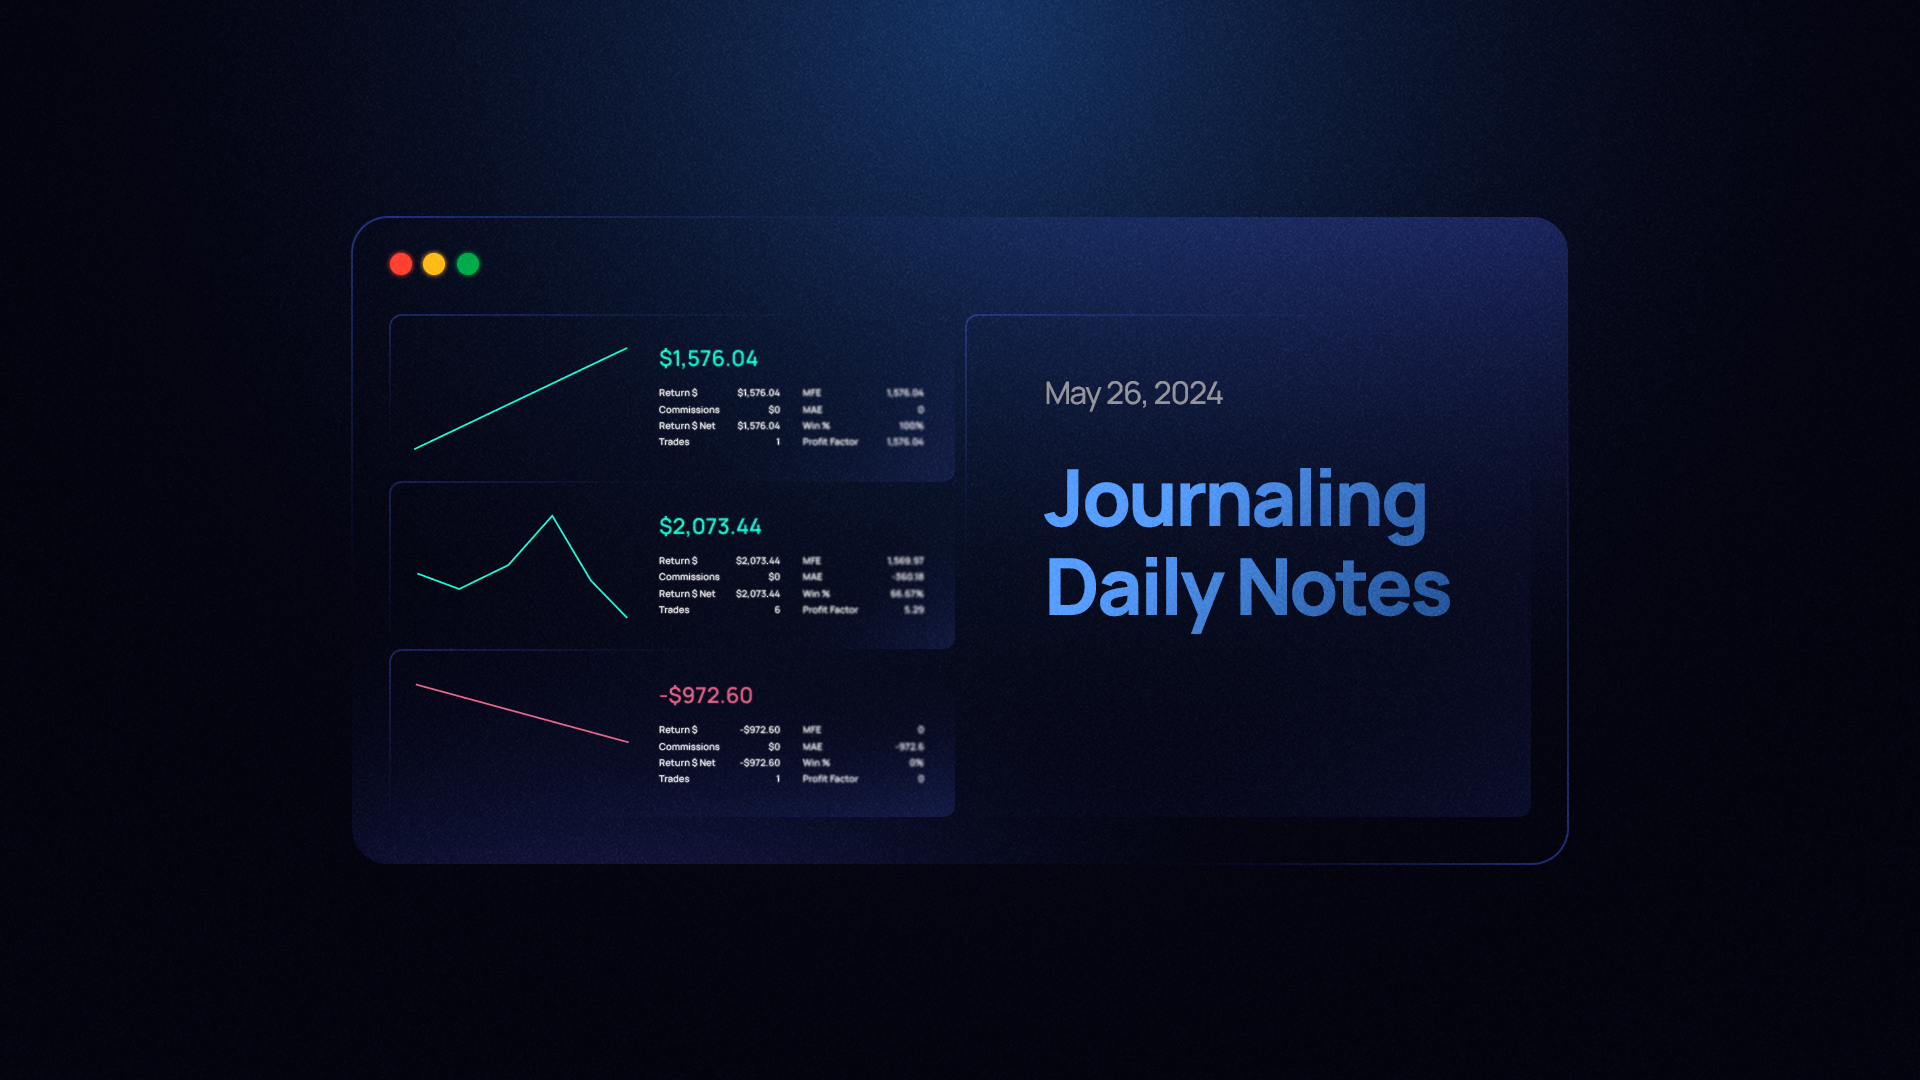
Each day you trade, you’ll see a summary box containing:
- Return $ Gross
- Return $ Net
- Commissions
- Trades
- MFE (Maximum Favorable Excursion)
- MAE (Maximum Adverse Excursion)
- Win %
- Profit Factor
- Daily Running PnL Graph
Understanding the Daily Running PnL
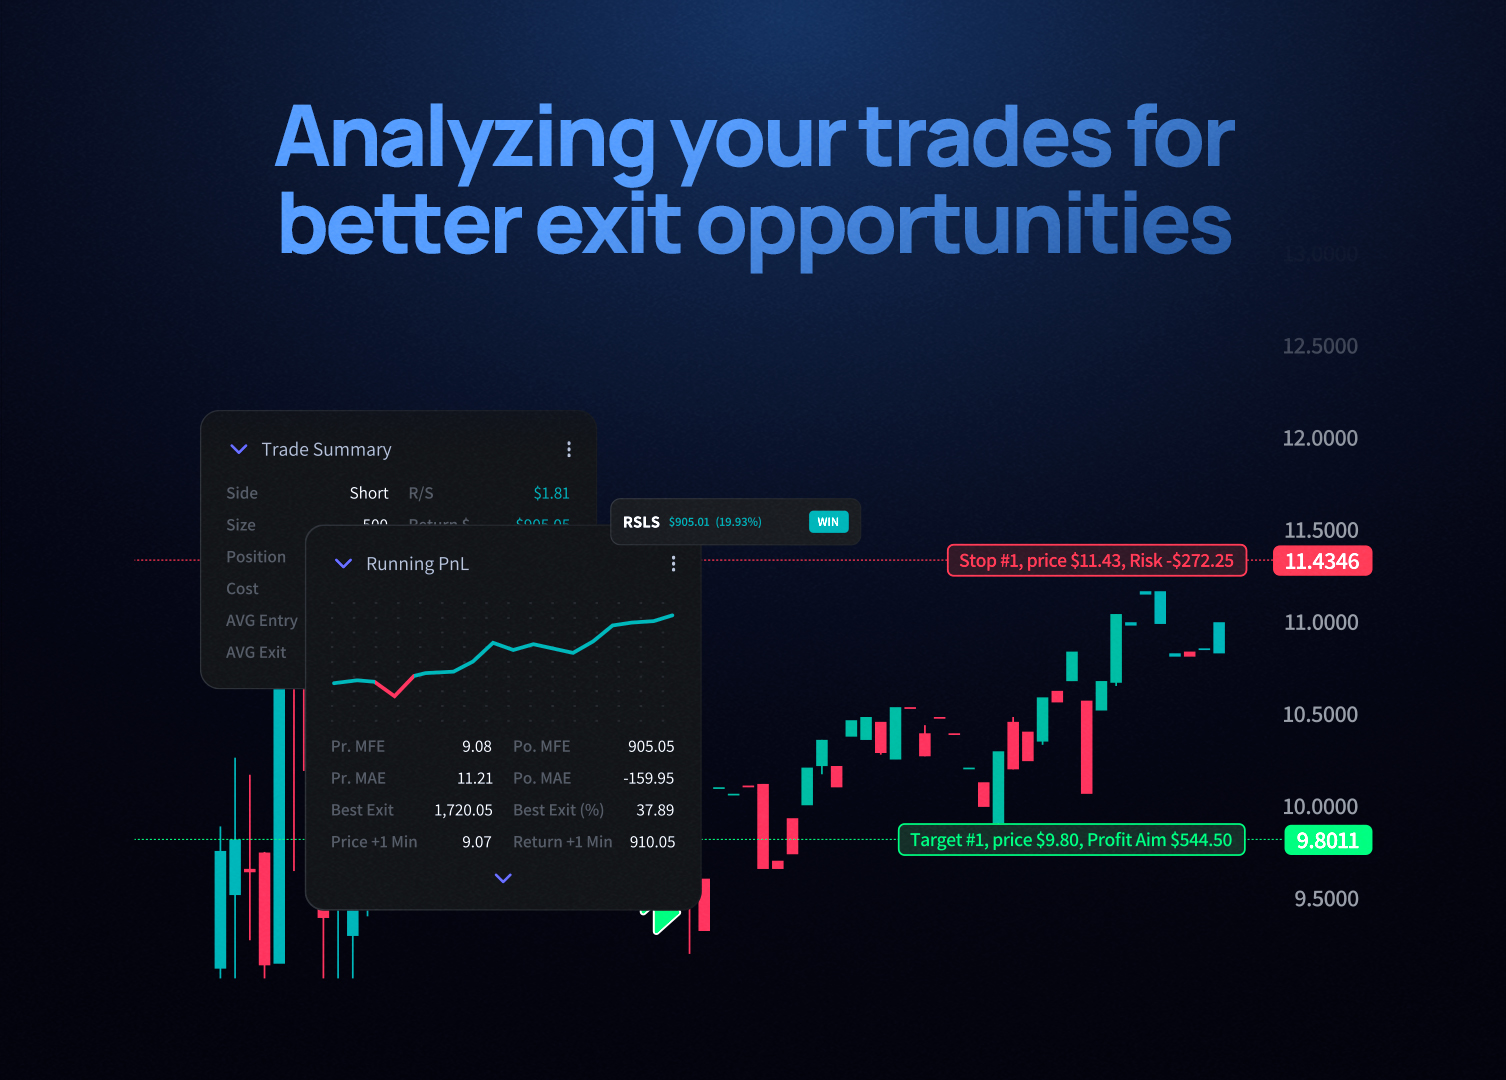
The Daily Running PnL graph tracks realized and unrealized gains/losses for closed trades throughout the day.
Example
Position 1 Running PnL: EURUSD:
- 01:00 PM – You opened a position
- 01:30 PM – You were up $50
- 02:00 PM – You were down -$150
- 03:00 PM – You closed the position for a loss of -$30
Position 2 Running PnL: BTCUSDT:
- 10:00 AM – You opened a position
- 11:00 AM – You were down -$50
- 01:30 PM – You were up $60
- 02:00 PM – You were up $10
- 03:00 PM – You closed the position for a gain of $20
The Daily Running PnL is calculated by algebraically adding the running PnL of both positions throughout the day.
Daily Running PnL Calculation:
| Time | EURUSD | BTCUSDT | Running PnL |
| 11:00 AM | 0 | -50 (unrealized pnl) | -50 (0 – 50) |
| 01:30 PM | 50 (unrealized pnl) | 60 (unrealized pnl) | 110 (50 + 60) |
| 02:00 PM | -150 (unrealized pnl) | 10 (unrealized pnl) | -20 (-150 + 10) |
| 03:00 PM | -30 (realized pnl) | 20 (realized pnl) | 10 (-30 + 20) |
The running PnL Graph will be formed out of the following data:
- 11:00 AM | -50
- 01:30 PM | +110
- 02:00 PM | -20
- 03:00 PM | +10
Key Points
- Daily Running PnL focuses on closed trades.
- It reflects gains/losses while the position was open, not your current market position.
- It combines results across all accounts (filters can be applied).
Adding Notes On Non-Trading Dates
You can also add notes on non-trading dates. To do this:
- Click the “Add Note” icon at the top.
- Select a date and write your notes.

